The heart has four chambers and can be characterized as two pumps connected in series, each composed of an atrium and a ventricle. The atria function primarily as conduits to the ventricles, but they also contract weakly to facilitate movement of blood into the ventricles during the filling phase, diastole. The ventricles serve as pumps during systole to supply the main force that propels blood through the systemic and pulmonary circulations. Specialized excitatory and conductive fibers in the heart maintain cardiac rhythm and transmit action potentials through cardiac muscle to initiate contraction. Because the heart is coupled to two circulations in series, its function is influenced by the characteristics of both.
Cardiac Anatomy
Pericardium
The pericardium is a fibrous sac that contains the heart and the proximal portions of great vessels. It consists of two layers, the fibrous and serosal pericardium. The fibrous layer is fibrocollagenous and is continuous superiorly with the adventitia of the great vessels and the pretracheal fascia and inferiorly with the diaphragm. Anteriorly, the fibrous layer attaches to the sternum through the sternopericardial ligaments. The aorta, pulmonary arteries, and pulmonary veins also receive extensions from the fibrous pericardium. The serosal layer of the pericardium is enclosed within the fibrous pericardium and consists of a single, continuous membrane that is divided into two parts, the visceral and the parietal pericardium. The visceral layer surrounds the heart and the great vessels and is reflected on to the parietal layer that lines the inner surface of the fibrous pericardium.1–3
The potential space between visceral and parietal pericardium normally contains 15 to 35 mL of pericardial fluid. The inelastic nature of the pericardium limits acute dilation of the heart and enhances the resulting mechanical interaction of the four cardiac chambers. Acutely, the pericardium can only accommodate a small amount of pericardial fluid without changes in intrapericardial pressure. Once the amount of pericardial fluid exceeds a limited reserve capacity, the intrapericardial pressure increases steeply with small amounts of pericardial fluid, leading to tamponade physiology. Chronically, the pericardium can accommodate a large amount of fluid without causing tamponade because its size and compliance increase in compensation. 1–3
Heart
The heart consists of four chambers. The right atrium receives deoxygenated blood from the superior vena cava, the inferior vena cava, the coronary sinus, and Thebesian cardiac veins. It pumps deoxygenated blood into right ventricle through the tricuspid valve. The right atrium is divided into three regions, the posteriorly located smooth-walled venous component, the anteriorly located vestibule of the tricuspid valve, and the right auricle. The venous component, or the sinus venosum, receives the vena cavae and the coronary sinus. The venous part of the atrium is separated from atrium proper and the auricle by a ridge of muscle called the crista terminalis. The pectinate muscles are muscular trabeculae that extend anterolaterally from crista terminals into the auricle. Anterior to the orifice of inferior vena cava is the eustachian valve, which in the fetal circulation directs oxygen-rich blood from placenta into left atrium through the foramen ovale of atrial septum. The fossa ovalis is the thin part of the atrial septum, above and to the left of the orifice of inferior vena cava. The vestibule of the tricuspid valve is the anteroinferior portion of right atrium.1,4
The atrioventricular valvular complex, both on the right and the left side (tricuspid and mitral valve), consists of the annulus, the leaflets, the chordae tendineae, and the papillary muscles. The tricuspid valve is so named as it has three leaflets, one each located anterosuperiorly, septally, and inferiorly. The chordae tendineae are fibrous collagenous structures that support the leaflets of tricuspid and mitral valves during systole. True chordae arise usually from the papillary muscles or from the ventricular free wall and the septum. There are three papillary muscles in the right ventricle: two larger, located in the anterior and posterior positions of the right ventricle, and a smaller muscle arising from the ventricular septum.1,4
The right ventricle consists of the inlet adjacent to the tricuspid valve and the apex, both of which are trabeculated. The smooth-walled infundibulum or the outlet connects to the pulmonic valve. The inlet and outlet components are separated by a transverse ridge of muscle called the supraventricular crest or the crista supraventricularis. The many muscular ridges and protrusions into the inner surface of the inlet and apex are known as trabeculae carneae. The septal band or the septomarginal trabecula reinforces the septal surface; at the apex, it supports the anterior papillary muscle, from where it crosses to the parietal wall of the ventricle as the moderator band. The pulmonic valve is located at the distal end of the infundibulum and consists of three semilunar cusps, an anterior, a right, and a left cusp.1,4
The left atrium is normally smaller in size than the right but has thicker walls. The right atrium is anterior and somewhat to the right of the left atrium. The right and the left atrium are separated by the obliquely positioned atrial septum. The superior posterior aspect of the left atrium receives the pulmonary veins and forms the anatomic base of the heart. The left auricle is longer and narrower than the right auricle and is the only portion of the left atrium that is trabeculated.1,4
The mitral valve apparatus consists of an orifice with an annulus, anterior and posterior leaflets, many chordae tendineae, and two papillary muscles. The anterior and posterior leaflets converge at the anterolateral and posteromedial commissures, each of which is associated with a papillary muscle. The anterior leaflet is semicircular and occupies one-third of the circumference, whereas the posterior leaflet is elongated and narrow and is attached to the remaining two-thirds of the annulus. The posterior leaflet is divided into three parts based on the presence of two indentations: a lateral P1, a central P2, and a medial P3 scallop. The segments of anterior leaflet opposing the posterior leaflet are similarly designated as A1, A2, and A3 scallop (Fig. 15-1).5
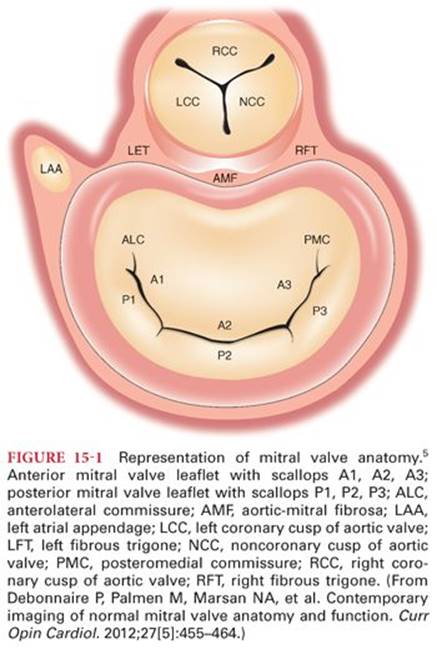
The subvalvular apparatus consists of chordae tendineae and the papillary muscles. The chordae tendineae attach to the edges of mitral leaflets or to its ventricular surface. The left ventricle has two papillary muscles: the anterolateral papillary muscle and the posteromedial papillary muscle. The chordae tendineae arise from the papillary muscle and attach to the ipsilateral half of anterior and posterior mitral leaflets.1,4
The left ventricle is a cone-shaped structure that is longer and narrower than the right ventricle. In the long axis, it descends forward and to the left from its base at the atrioventricular groove to form the cardiac apex. Its walls are normally about two to three times thicker than the right ventricle. It consists of the inlet region, the apical trabecular component, and the smooth-walled outflow tract. Unlike the valvular orifices of the right ventricle, the orifices of the aortic and mitral valve are in fibrous continuity. The left ventricular outflow tract ends at the aortic valve. The aortic valve consists of three semilunar cusps that are supported within the three aortic sinuses of Valsalva. The cusps and the sinuses are called left, right, and noncoronary.1,4
The Coronary Circulation
A unique feature of the coronary circulation is that the heart requires a continuous delivery of oxygen by coronary blood flow to function. At rest, the myocardium extracts about 75% of the oxygen delivered by coronary blood flow more than any other tissue in the body. So whenever myocardial oxygen demand increases, as with exercise, the coronary arteries must dilate to increase blood flow and oxygen delivery to meet the demand, or ischemia results. This coronary artery dilation is mediated through the local release of vasodilator substances within the myocardium.6,7
The right (RCA) and the left (LCA) coronary arteries arise respectively from the upper part of the right and the left coronary sinus of Valsalva and are the first branches of the aorta (Fig. 15-2). The RCA usually supplies the most of the right ventricle, a small part of the diaphragmatic aspect of left ventricle, the right atrium, part of left atrium, and posteroinferior one-third of interventricular septum. The first segment of the RCA gives rise to right ventricular and atrial branches. The right ventricular branches are the right conus artery or the infundibular artery and the acute marginal arteries. The atrial branch in majority of the population is the artery to the sinoatrial node. The RCA passes directly into the right interventricular groove and descends to the right cardiac border, where it curves posteriorly and approaches the junction of interatrial and interventricular grooves (the crux of the heart) and gives rise to the posterior descending artery (PDA). Coronary artery dominance is defined by the artery that supplies the PDA. In 70% of the population, the PDA is supplied by the RCA, coronary circulation referred to as right dominant. In 10% of the population, the PDA is supplied by circumflex artery (CxA) and is left dominant. In the remainder, the PDA is supplied by both the RCA and the CxA and the coronary circulation is considered codominant.1,6

The left main coronary artery usually supplies the free wall of the left ventricle, a narrow strip of the right ventricle anteriorly, the anterior two-thirds of ventricular septum, and most of left atrium. After arising from the left coronary sinus, the left main coronary artery passes to the left atrioventricular groove, where it branches into left anterior descending artery (LAD) and the CxA. The LAD, also known as anterior interventricular artery, runs in the anterior interventricular groove and gives off right and left diagonal and septal branches. The right diagonal branches are small and rare; the left diagonal arteries can vary in number anywhere from two to nine and cross the anterior surface of the left ventricle. The septal branches supply most of the interventricular septum. The first septal branch is usually targeted for ablation in interventional treatment for hypertrophic cardiomyopathy. The CxA curves left in atrioventricular groove giving rise to obtuse marginal branches extending over the posterolateral wall toward the apex. The CxA continues into the posterior part of the atrioventricular groove, usually terminating prior to the crux of the heart, but in 10% of individuals, it continues to supply the PDA.1,6
The cardiac veins that run in atrioventricular and interventricular grooves drain a large part of coronary arterial blood into the right atrium via the coronary sinus (CS). The great cardiac vein that accompanies the LAD is joined by the oblique vein of the left atrium in the left atrioventricular groove to become the CS. Prior to draining into the right atrium, the middle cardiac vein that runs in the inferior interventricular groove and small cardiac vein that runs in right atrioventricular groove drain into the CS.1,6
The Cardiac Conduction System
The cardiac conduction system consists of the sinoatrial (SA) node, the atrioventricular (AV) node, the AV bundle also known as the bundle of His, the bundle branches, and the Purkinje fibers (Fig. 15-3). The cardiac impulse is normally initiated by the SA node. This causes the atria to contract, first the right atrium followed by the left atrium. The blood supply to the SA node may be from either the RCA or the CxA.

From the SA node, the impulse is conducted to the AV node via the atrial myocardium. The AV node is located at the apex of region formed by the opening of the CS, the septal leaflet of the tricuspid valve, and the atrial septum, called the triangle of Koch. The AV node is supplied by the RCA in a large majority of population, in the rest by the CxA. The cardiac electrical impulse is delayed in the AV node about a fifth of a second before being conducted to the bundle of His and on to the ventricles, so that the atria contract just before the ventricles to augment end diastolic filling. The bundle of His branches into right and left bundle branches. The left bundle splits further into anterior and posterior fascicles. The bundle branches descend through the ventricular septum, where they continue on as the Purkinje fibers that end up directly stimulating the myocardium to contract. The bundle of His and bundle branches are insulated from the myocardium by a fibrous sheath, thus forming specialized network of conduction tissue. This functional organization results in a coordinated, synchronized contraction of the atria and ventricles, improving the efficiency of the heart.1,6,8,9
Clinical Electrophysiology and Electrocardiogram
Body fluids are good electrical conductors, making it possible to record the sum of the action potentials of the cardiac cells on the surface of the body. Continuous monitoring of this electrocardiogram (ECG) during anesthesia is considered to be a standard of monitoring for all patients under the anesthesiologist’s care. It is an essential tool for detecting myocardial ischemia, arrhythmias, and conduction system abnormalities.
Electrocardiogram Leads
The cardiac electrical activity is usually measured by electrodes placed on the skin. Bipolar leads consist of two electrodes, one positive and one negative. Unipolar leads consist of one positive electrode (exploring) and a composite pole that averages electrical activity from a number of other leads to zero potential, referred to as the indifferent electrode. Depolarization directed toward the positive electrode produces a positive deflection, whereas directed away from it produces a negative deflection. When the depolarization wave is perpendicular to the lead, a biphasic deflection is recorded (Fig. 15-4). The 12-lead ECG consists of three bipolar standard limb leads, six unipolar precordial leads, and three unipolar augmented limb leads. The standard limb leads and the augmented limb leads record electrical impulses that flow in the frontal plane, whereas the precordial leads record impulses in the horizontal plane.

Standard Limb Leads
The standard limb leads, named I, II, and III, record the potential difference between two points of the body (Fig. 15-5). In lead I, the electrodes are placed on the left shoulder (positive) and right shoulder (negative). In lead II, the positive electrode is on the left leg and the negative is on the right shoulder. In lead III, the positive electrode is on the left leg and the negative on the left arm. The limb leads form the triangle of Einthoven, which is used together with the augmented limb leads to calculate the electrical axis of the heart in the frontal axis. The direction of the depolarization of the atria parallels lead II, resulting in a prominent P wave in this lead.

Augmented Limb Leads
Augmented leads are similar to the standard limb leads but are unipolar. Linking the three limb leads through equal resistances (5,000 Ω), a central terminal is created with zero potential (Wilson’s central terminal). This is based on Einthoven’s theory that the R wave in lead II equals the sum of the R waves in leads I and III. The central terminal presents a stable reference potential point that is used to measure the varying potential at the exploring electrode (Fig. 15-6). Goldberger modified the central terminal by removing its link from the exploring electrode, achieving augmentation on the ECG deflections.10 The positive (exploring) electrode for augmented voltage right arm (aVR) is on the right shoulder, for augmented voltage left arm (aVL) on the left shoulder, and for augmented voltage foot (aVF) on the left leg.

Precordial Leads
The precordial (V1 to V6) are unipolar leads that are placed on the chest wall, with the exploring electrode over one of six separate points (Table 15-1). The “indifferent” electrode is represented by the Wilson’s central terminal, which is the average of the standard limb leads and normally has zero potential. The proximity of the heart surface to the electrode allows for detection of relatively small abnormalities in the ventricles without augmentation. Electric current flow is normally from the base to the apex of the heart. Therefore, leads V1 and V2, being near the base, record a negatively deflected QRS. Conversely, V4 to V6, being nearer the apex, record a positively deflected QRS.

Electrocardiographic Axis of the Heart
The axis represents the overall direction of the electric impulse in the heart and is created by averaging all the action potentials. It is biased toward the left because of the larger muscle mass of the left ventricle compared to the right. The standard limb leads combined with the augmented limb leads form the hexaxial diagram, which is used to calculate the electrical axis of the heart on the frontal plane (Fig. 15-7). This axis normally ranges between −30 and 90 degrees. Hypertrophy of the left ventricle shifts the axis to the left, and hypertrophy of the right shifts it to the right. Left axis deviation is defined as an axis less than −30 degrees and right axis deviation as more than 90 degrees. Abnormalities in the normal conduction pathway (blocks) in the heart also cause changes in the electrical axis.

Electrocardiogram Lead Systems
The three-lead system is the most basic ECG system. It consists of three electrodes, placed on the right arm, left arm, and left leg. It monitors electrical activity recorded by the bipolar standard limb leads (I, II, and II). Only one lead at a time is available. Two electrodes are used to form the selected lead and the third becomes the ground. Although the three-lead ECG provides adequate monitoring for arrhythmias, its use for detection of myocardial ischemia is limited.
In the modified three-lead bipolar standard limb lead system, the electrodes are placed in different locations on the chest wall. This allows for improved detection of arrhythmias (taller P waves) and monitoring for ischemia of the heart surface closer to each exploring pole. In the central subclavicular lead system (SC5), one electrode is placed under the right clavicle, one in the V5 position, and the ground electrode on the left leg. Other modified systems include the modified central leads (MCL), central manubrial (CM5), central back (CB5), and central cardiac 5 (V5) lead systems (Fig. 15-8).

The five-lead system uses five electrodes placed on the right arm, right leg, left arm, left leg, and one on the chest wall in any one position from V1 to V6. Seven leads at a time may be monitored, six bipolar (I, II, III, aVR, aVL, aVF) and one unipolar (usually V5.) The 10-lead system allows monitoring of 12 leads simultaneously, the 3 standard limb leads (I, II, III), the 3 augmented limb leads (aVR, aVL, aVF), and 6 precordial leads (V1 to V6). The electrodes are placed on the right arm and leg, left arm and leg, and on the anterior and anterolateral chest wall. This allows for monitoring of specific areas of the heart. Leads V1 to V4 monitor the anterior wall; leads I, aVL, V5, and V6, the lateral wall; and II, III, and aVF, the inferior wall.
London and colleagues11 examined lead sensitivity for detecting intraoperative myocardial ischemia. They concluded that using single-lead monitoring, V5 had the greatest sensitivity, 75%, whereas V4 had 61%. V4 and V5combined had 90%. Sensitivity for the standard combination used in the clinical setting, II and V5, was 80%. Adding V4 to II and V5 increased the sensitivity to 96%. Although lead V4 is more sensitive in detecting ischemia, lead II is superior in monitoring atrial arrhythmias.11
Invasive ECG may monitor the cardiac electrical activity using leads placed in the trachea, the esophagus, in the cardiac cavities, or the coronary vessels but are not used in the routine anesthesia practice. The His bundle ECG uses an electrode on a catheter in the heart placed near the tricuspid valve (Fig. 15-9). It records the activation of the AV node (A), the spreading of the electrical activity through the His bundle (H), and the ventricular depolarization (V). Information from the standard ECG and the His bundle ECG can be used to measure the time required for the impulse to travel between the sinus node and the AV node (AH) and through the AV node to the bundle of His and the ventricles. This allows detection of the site of a conduction delay, important for prognosis and treatment.

Decreased voltage on the ECG may be caused by multiple small myocardial infarcts, which prevent generation of large quantities of electrical currents or abnormal conditions around the heart that impede current conduction from the heart to the skin, such as pericardial fluid and pulmonary emphysema.
It is important to differentiate artifacts from real ECG findings. Artifacts may be caused by malfunctioning ECG system (cables, connections, etc.), improper skin preparation (oil, hair), lead misplacement/poor contact, patient’s tremor/shivering, or muscular activity. External sources emitting electrical fields (electrocautery, 60 Hz power lines/light fixtures), cardiopulmonary bypass, somatosensory-evoked potential monitoring, and stimulators may also interfere with ECG recordings. All modern ECG monitors have incorporated filters for signal processing to minimize the presence of electrical artifacts.
Recording of the Electrocardiogram
The ECG is recorded on a graph paper consisting of 1-mm squares with every five squares separated by a darker line. Each 1-mm horizontal line represents 0.04 second and each 1-mm vertical line represents 0.1 mV, assuming proper calibration 1 cm/1 mV and standardized paper speed of 25 mm per second. Therefore, the distance between two darker lines represents 0.2 second and 0.5 mV on the horizontal and the vertical axes respectively. One minute (60 seconds) corresponds to 1,500 small or 300 big squares. The heart rate in beats per minute can be calculated by dividing 300 by the number of large boxes (or 1,500 by the number of small boxes) counted between two beats. Another method of calculating heart rate in beats per minute is to divide 60 by the number of seconds (= 0.04 second × number of small boxes) between two consecutive beats.
The electrical activity that activates the cardiac contraction is observed on a monitor display as a graph of voltage change through time. Modern monitors also have paper recorders allowing more thorough analysis of the ECG in complex situations. The Holter monitor is a small portable digital recorder that enables recording of the ECG for prolonged periods in ambulatory individuals to detect infrequent events.
Normal Electrocardiographic Deflections
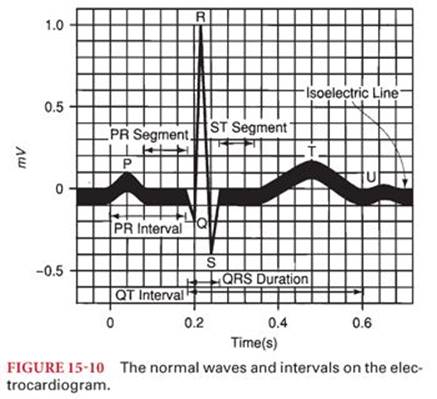
Normally, the cardiac electrical impulse is initiated at the SA node, which is located at junction of the superior vena cava to the right atrium. Any part of the conduction system can spontaneously depolarize and initiate an impulse, but the SA node normally has the highest rate of depolarization and is the pacemaker of the heart. The impulse is transmitted through the right and left intraatrial pathways to the AV node and then to the bundle of His and through the Purkinje fibers to the ventricular subendocardium, which causes the myocardium to depolarize from the endocardium to the epicardium. Repolarization happens in the reverse direction, from the epicardium to the endocardium. The speed of conduction is different between the various areas of the system, with the slowest through the AV node producing AV synchrony for optimal end diastolic filling from atrial contraction. The normal ECG consists of a P wave (atrial systole), a QRS complex (ventricular systole), and a T wave (ventricular repolarization). The atrial repolarization wave is obscured by the larger QRS complex (Fig. 15-10).
P Wave
The P wave represents the atrial depolarization and has a normal duration and amplitude of 0.08 to 0.12 second and less than 2.5 mm in the limb leads. Morphologically, it is positive in the standard limb leads and negative in aVR. Enlarged P wave signifies atrial enlargement.
P-R Interval
The P-R interval corresponds to the time from the beginning of the atrial depolarization to the beginning of the ventricular depolarization. It is measured from the start of the P wave to the start of the QRS and should not be confused with the PR segment, which is measured from the end of the P wave to the start of the QRS. The normal duration of the P-R interval is 0.12 to 0.2 second. Prolonged P-R interval is called first-degree AV block. In pericarditis, the P-R interval is depressed in most leads (whereas ST is elevated) and elevated in aVR (knuckle sign) (Fig. 15-11).

Q Wave
The Q wave is defined as an initial negative deflection of the QRS and is usually absent in leads aVR, V1, and V2. Normally, its duration is shorter than 0.04 second and its amplitude less than 0.4 to 0.5 mV. A Q wave whose amplitude is more than one-third of the corresponding R wave, duration is longer than 0.04 second, and depth is greater than 1 mm, is indicative of myocardial infarction (MI). The Q wave occurs because there is no electrical activity in the affected area. Therefore, the direction of the sum of the action potentials in the specific plane changes and is recorded accordingly. In the presence of anterior wall MI, Q waves develop in leads V2 to V4; in anteroseptal MI, in leads V1 to V3; in anterolateral MI, in leads V4 to V6 and I and aVL; in lateral MI, in leads V5, V6, I, and aVL; and in inferior MI, in leads II, III, and aVF.
QRS Complex
The QRS complex is caused by the depolarization of the ventricles and normally has a duration of less than 0.10 second. A prolonged QRS duration may be due to left ventricular hypertrophy (LVH), impaired ventricular conduction (bundle branch block), beats initiated outside the conduction system (ectopic or paced beats), and beats passing through abnormal conduction pathways (Wolff-Parkinson-White syndrome). Normally, the QRS amplitude gradually increases in the precordial leads from V1 to V5, a phenomenon called R wave progression. The R wave is usually upright in the limb leads and downwardly deflected in aVR and V1. Various criteria exist for defining LVH using the QRS amplitude. According to the Cornell criteria, LVH is present when the sum of the R wave in aVL and S wave in V3 is greater than 28 mm in males and 20 mm in females. Based on the Sokolow-Lyon criteria, LVH is present when SV1 + (R in V5 or R in V6) is greater than 35 mm or R in aVL is greater than 11 mm.
ST Segment
The ST segment starts when all myocardial cells are depolarized (end of QRS) and ends when ventricular repolarization begins (T wave). It is normally isoelectric and elevation or depression more than 1 mm from the baseline may indicate myocardial ischemia. Hyperkalemia and pericarditis may also cause ST elevation. J point elevation (where QRS and ST segment connect) and normal variants of early repolarization are nonpathologic findings that must be excluded (Fig. 15-12).

T Wave
The T wave is caused by the repolarization of the ventricles, and its normal amplitude is less than 10 mm in the precordial leads and 6 mm in the limb leads. Usually, in any lead, the T wave is deflected in the same directions as the QRS. Delay of conduction of cardiac impulses through the ventricles (prolonged depolarization), as occurs with myocardial ischemia, bundle branch blocks, or ectopic ventricular beats, may result in T-wave polarity opposite the QRS complex. Symmetrical or deeply inverted T waves may be indicative of myocardial ischemia. Inverted T waves in V1 to V3 in children (juvenile T waves) and occasionally in women can be a normal variant. Peaked T waves may be present in hyperkalemia, LVH, and intracranial bleeding.
U Wave
The U wave, when present, follows the T wave and it probably represents part of the ventricular repolarization. It is most prominent in V2 and V3. Causes of increased U wave amplitude (>1.5 mm) include LVH, bradycardia, ischemia, electrolyte abnormalities (low potassium, magnesium, calcium), and medications.
QT Interval
The QT interval includes both ventricular depolarization and repolarization. It is measured from the beginning of the QRS to the end of the T wave and varies in duration according to heart rate. The QT interval corrected for heart rate (QTc) is calculated by dividing the QT interval by the squared root of the RR interval. Prolonged QTc (>0.44 second) may be associated with ventricular arrhythmias. Causes of prolonged QT include hypocalcemia, hypomagnesemia, medications, severe bradycardia, hypothermia, ischemia, intracranial hemorrhage, and myxedema of hypothyroidism.
Cardiac Physiology
Myocardium
The myocardium is the involuntary, striated muscle tissue in the heart between the epicardium and the endocardium; its cells are called cardiomyocytes. The primary structural proteins of the cardiac muscle are actin and myosin filaments, which interdigitate and slide along each other during contraction in a manner similar to skeletal muscle. But unlike the skeletal muscle in which the actin and myosin filaments are linear and longitudinal, in cardiomyocytes, they are branched (Fig. 15-13).12 Also, the cardiac T tubules are larger and broader and fewer in number than skeletal muscle. Cardiac muscle T tubules form diads with the sarcoplasmic reticulum intercalated discs with permeable junctions that allow rapid diffusion of ions so that action potentials travel easily from cell to cell. Thus, cardiomyocytes are functionally interconnected in a syncytium, so that activation of one cell results in the spread to all connected cells. The atrial syncytium is separated from the ventricular syncytium by the fibrous tissues around the AV valves, and the cardiac action potential is normally only conducted from the atria to the ventricles by a specialized conduction pathway through the AV node.13

Cardiac Action Potential
At the initiation of an action potential in a cardiomyocyte, the cell membrane rapidly depolarizes as the transmembrane potential rises from −85 mV to +20 mV. The membrane remains depolarized for about 0.2 second, the plateau phase, which is then followed by rapid repolarization. This plateau causes the contraction of a cardiomyocyte to last much longer than a skeletal muscle cell and is due to the slow calcium channels, which open after the sodium channels and remain open several tenths of a second. Depolarization of the cardiomyocyte is also prolonged by a decrease in permeability of the potassium channels after initiation of the action potential, another difference from skeletal muscle. During the plateau phase, the cardiomyocyte cannot be restimulated for about 0.25 to 0.3 second, called the refractory period. This is followed for additional 0.05 second by the relative refractory period, when the myocardium can only be stimulated by a strong excitatory signal.12,14
Excitation–Contraction Coupling
Excitation–contraction coupling in both cardiac and skeletal muscle occurs when the action potential spreads into the cell through transverse tubules (T tubules). Depolarization of the T tubule causes influx of calcium into the sarcoplasm, which binds to troponin activating the contraction of actin and myosin filaments. In the cardiomyocyte, however, the initial influx of calcium ions is just a small fraction of the amount needed for contraction, and it triggers an additional release of calcium from the sarcoplasmic reticulum into the sarcoplasm. The structural differences between cardiac and skeletal muscle reflect the difference in coupling mechanism. Myocardium has sparser and less developed sarcoplasmic reticulum and the T tubules are larger and store more calcium.15,16
Control of Cardiac Function
Neural Control
Heart function is controlled by the autonomic nervous system by both adrenergic and muscarinic acetylcholine receptors, modulating the cardiac output by influencing heart rate and myocardial contraction. The sympathetic nervous system, through adrenergic receptors with the neurotransmitter norepinephrine, has positive inotropic, chronotropic, and lusitropic effects on the heart. The parasympathetic nervous system, acting through muscarinic receptors with the neurotransmitter acetylcholine, has a more direct inhibitory effect on the heart through the vagal nerve reducing heart rate, AV node conduction, and cardiac contractility. The atria are innervated by both the sympathetic and parasympathetic nervous system, but the ventricles are supplied principally by the sympathetic nervous system (Fig. 15-14).12,17

Sympathetic nervous system fibers to the heart continually discharge at a slow rate maintaining a strength of ventricular contraction about 20% to 25% above the unstimulated state. Maximal sympathetic nervous system stimulation can increase cardiac output by about 100% above normal. Conversely, maximal parasympathetic nervous system stimulation decreases ventricular contractile strength only by about 30%, as the vagal innervation is sparse in the ventricles. Strong stimulation of the parasympathetic system can result in a period of asystole, followed by an escape rhythm between 20 and 40 beats per minute.12,18
Hormonal Control
Many hormones can have direct and indirect action on the heart during normal or pathophysiologic conditions. These hormones are produced within cardiomyocytes or by other tissues in the body. The hormones secreted by cardiomyocytes include natriuretic peptide, adrenomedullin, aldosterone, and angiotensin II.19–21 Atrial (ANP) and B-type natriuretic protein (BNP) are released from atria and ventricle in response to increased stretch of the chamber wall. Both ANP and BNP participate in homeostasis of body fluids, in regulation of blood pressure, and in growth and development of cardiac tissue. In chronic heart failure, high ANP and BNP levels have been associated with increased mortality.19 Adrenomedullin is a peptide hormone that increases level of cyclic adenosine monophosphate (cAMP) and has positive inotropic and chronotropic effects on the heart and is a vasodilator. The renin-angiotensin system is an important regulator of the cardiovascular system. Angiotensin II stimulates AT1 receptors with positive inotropic and chronotropic effects. It also mediates cell growth and proliferation of cardiomyocytes, thus playing an important role in development of remodeling during cardiac hypertrophy and heart failure.21
Cardiac Cycle
Electrical and Mechanical Events
The cardiac cycle is a series of coordinated electromechanical events that result in the ejection of blood from the heart into the great vessels. Ventricular systole is defined as the period of myocardial contraction when the aortic and pulmonic valves are open and diastole as the period of relaxation and ventricular filling when the mitral and tricuspid valves are open. Each mechanical event is preceded by an electrical depolarization that generates an action potential and subsequent contraction.
Carl J. Wiggers22 elegantly illustrated the mechanical, electrical, and acoustic events of the cardiac cycle. His diagram depicts the aortic, ventricular, and atrial pressure tracings with concomitant ECG, ventricular volume, and auscultatory findings22 (Fig. 15-15). Systole begins with isometric contraction (A to C), followed by opening of the aortic valve and ejection of blood into the aorta, with a period of maximum ejection (C to D) and reduced ejection (D to F). Isometric contraction starts with closure of the mitral valve and ends with opening of the aortic valve, during which time no volume enters or leaves the ventricle. Approximately two-thirds of stroke volume is ejected during the period of maximum ejection and one-third during the period of reduced ejection. The ventricular volume curve that coincides with this event is inversely related to the aortic and ventricular pressure curves. Simultaneous electrical depolarization corresponds with the QRS complex of the ECG.

Diastole follows systole and is divided into prodiastole (F and G), isometric relaxation (G and H), rapid ventricular filling (H and I), diastasis (I and J), and filling by atrial contraction (J and K). During prodiastole, the semilunar, aortic, and pulmonic valves close. This is followed by isometric relaxation, the time between closure of the aortic valve and opening of the mitral valve. Ventricular filling depends on both the relaxation of the myocardium and chamber compliance.23 There is a period of diastasis with minimal flow during which the ventricular volume remains relatively constant. This is followed by atrial contraction during late diastole, synchronous with the P wave of atrial depolarization on the ECG.
The atrial pressure tracing, or central venous waveform, begins with an “a” wave that corresponds to atrial contraction at end diastole. The “c” wave represents ventricular systole during which time the right atrial pressure increases slightly as the right ventricle contracts against a closed tricuspid valve. The subsequent downward slope in the waveform, the “x descent,” corresponds to atrial relaxation. The “v” wave occurs during venous filling of the right atria towards the end of systole. The “y descent” represents a fall in right atrial pressures as the tricuspid valve opens and the right ventricle fills in diastole24 (Fig. 15-16).

Myocardial Performance, Preload, and Afterload
In the early 1900s, Frank Otto and Ernest Henry Starling described what is known today as the Frank-Starling mechanism. In a series of publications, they demonstrated that myocardial stretch, called preload, induced by increased venous return to the heart augments cardiac output,25 and that increased end diastolic volume or right atrial pressure enhances myocardial contractility.26,27
In canine experiments, Arthur C. Guyton,28 identified two factors affecting venous return or preload to the ventricle: right atrial pressure and mean circulatory filling pressure. Higher right atrial pressure diminishes venous return to the heart, whereas higher mean circulatory filling pressure, as measured by temporary cessation of cardiac output and equilibration of peripheral pressures, increases venous return. Increasing mean circulatory filling pressure, for example by transfusion, enhances venous return to the heart, thereby augmenting cardiac output without affecting contractility. He synthesized these findings with the Frank-Starling mechanism and graphically displayed superimposing cardiac response and venous return curves (Fig. 15-17).28,29

Afterload refers to the resistance or pressure against which the ventricle contracts. Mechanical obstruction such as aortic stenosis increases afterload and adversely affects myocardial performance. Pharmacologic interventions such as the administration of phenylephrine can increase afterload as well by increasing systemic vascular resistance. Afterload in its simplest interpretation often refers to the mean arterial pressure.
Left ventricular (LV) pressure–volume loops can be used to demonstrate how changes in preload and afterload affect stroke volume and end systolic and end diastolic pressure–volume relationships. The entire loop represents a single cardiac cycle with volume on the x-axis and pressure on the y-axis. The difference between end diastolic volume (EDV) and end systolic volume (ESV) equals stroke volume (SV). At end diastole, after closure of the mitral valve, isometric contraction increases the pressure in the LV cavity marking the beginning of systole. When the LV pressure exceeds that in the aorta, the aortic valve opens and ejection begins. After end systole and peak LV pressure, the aortic valve closes. This is followed by a brief period of isometric relaxation marking the beginning of diastole during which LV pressure falls and the LV volume does not change. Then the mitral valve opens, the LV fills accommodating the SV to be ejected during the subsequent cardiac contraction (Fig. 15-18A).

A drop in preload, for example with clamping of the inferior vena cava, will decrease SV, ESV, and EDV. The shape of the pressure–volume loop narrows, shortens, and shifts to the left30 (Fig. 15-18B). An increase in afterload, for example with administration of phenylephrine, will cause end systolic pressure and volume to increase and SV to decrease, the loops get narrower and longer (Fig. 15-18C).30 The slope of the end systolic pressure–volume relationship (ESPVR) is referred to as elastance and labelled “Ees” in the figures. It stays constant during changes in preload and afterload, is a measure of the strength of contraction, or contractility, and is steeper with increased contractility.31,32
Hemodynamic Calculations
Cardiac output (CO) is equal to heart rate multiplied by SV. As illustrated in the previous LV pressure–volume loops, SV = EDV − ESV. Mean arterial pressure (MAP) is two-third diastolic blood pressure plus one-third systolic blood pressure. MAP is also CO multiplied by systemic vascular resistance (Table 15-2).

There are several methods to measure CO, the volume of blood delivered by the heart to the body per minute, including thermodilution, the Fick method, and echocardiography. The thermodilution method uses a pulmonary artery (Swan-Ganz) catheter through which cool saline is injected into the right atrium. The cool saline mixes with warmer blood and the temperature change is recorded by a thermistor at the tip of the catheter, positioned in the main pulmonary artery. The CO is inversely proportional to the integral of the time-temperature curve.33,34 Limitations of this method include tricuspid regurgitation and the presence of intracardiac shunts. Tricuspid regurgitation will underestimate the CO, as the cool injectate travels retrograde into the vena cava increasing the time it takes to reach the pulmonary artery. Conversely, intracardiac left to right shunts can falsely overestimate the CO.
CO can also be measured using the Fick method. Fick CO (liters per minute) = (oxygen consumption VO2)/[(arteriovenous oxygen difference) × 10]. Oxygen consumption can be estimated based on a nomogram that accounts for patient age, sex, height, and weight. It can also be directly measured by exhaled breath analysis. The value 250 mL O2 per minute is often used as a standardized reference. The difference in arterial versus venous oxygen content (CaO2 − CvO2) is calculated by the following formula:
(CaO2 − CvO2) = (1.34 × Hgb × SaO2) − (1.34 × Hgb × SvO2)
where SaO2 is the arterial oxygen saturation and SvO2 is the mixed venous oxygen saturation, that is, the saturation of pulmonary arterial blood. The arterial venous oxygen difference is inversely related to CO as long as the oxygen consumption of the body is constant.
Lastly, CO can be calculated by echocardiography. Pulsed wave doppler is used to record the velocity profile of flow in the left ventricular outflow tract (LVOT). Tracing this profile gives the velocity time integral (VTI) in centimeters. The LVOT VTI is multiplied by area of the LVOT in square centimeters to obtain the SV in milliliters. The LVOT is assumed to be circular in shape. The area of a circle is πr2. The diameter of the LVOT is measured with two dimensional echocardiography and divided by two to obtain the radius in the area calculation. Therefore, SV = LVOT VTI × LVOT area (πr2). A similar calculation can be made to obtain the SV through the right ventricular outflow tract (RVOT). The two numbers are identical provided there is no intracardiac shunt or regurgitation of the aortic or pulmonic valves. Multiplying the SV by the patient’s heart rate yields CO.
After obtaining CO by one of these three methods, one can calculate systemic vascular resistance and pulmonary vascular resistance. Systemic vascular resistance (SVR) in Wood units is the MAP–central venous pressure divided by CO (see Table 15-2). To convert from Woods units to dynes/s/cm5, the result is multiplied by 80. Similarly, to calculate pulmonary vascular resistance, the pulmonary artery occlusion pressure (PAOP) (a surrogate for the left atrial pressure) is subtracted from the mean pulmonary arterial pressure, and the result is divided by CO. The same conversion from Woods units applies. Obtaining CO and calculating SVR can often aid in narrowing a differential diagnosis in various types of shock. A mixed venous oxygen saturation (SvO2) can also assist in narrowing the differential. Together, this information can guide therapeutic intervention toward inotropic support, volume administration, titration of vasopressors, or consideration of mechanical assist devices. In cardiogenic shock, for example, CO will be low, SVR high, and mixed venous saturation low. This is in contrast to vasodilatory or septic shock in which CO will be high, SVR low, and mixed venous saturation usually high. Normal hemodynamic values are listed in Table 15-3.

Pathophysiology
Ischemic Heart Disease
Ischemic heart disease refers to atherosclerosis of the coronary arteries that obstructs blood flow to the myocardium resulting in either stable symptoms, which can be medically managed, or unstable acute coronary syndromes, which may call for more invasive intervention such as revascularization by percutaneous coronary intervention (PCI) or coronary artery bypass graft (CABG) surgery. The development of atherosclerosis is an inflammatory process mediated by adherent leukocytes (phagocytes and T lymphocytes), cytokines, and smooth muscle cells that generate a lipid-rich necrotic plaque.35–37 Risk factors for ischemic heart disease include hypertension, cigarette smoking, hyperlipidemia, and abdominal obesity.
Acute coronary syndromes include the following three entities: unstable angina, non–ST elevation myocardial infarction (NSTEMI), and ST elevation myocardial infarction (STEMI). All suspected patients are evaluated with a 12-lead ECG and biomarkers of myocardial injury, troponin and CK-MB. Those patients who show clinical, electrocardiographic, and laboratory evidence of MI are treated with heparin and evaluated with angiography for consideration of PCI or surgical intervention.38,39
Medical management of stable ischemic heart disease begins with risk factor reduction. β Blockade has been shown to confer a survival benefit in patients with prior MI or a low ejection fraction and decreases myocardial oxygen consumption. Oral or sublingual nitrates are effective in angina prophylaxis or during acute episodes. Antiplatelet agents such as aspirin are indicated unless bleeding precludes their use.40–42 Statins are indicated for their lipid-lowering effects and antiinflammatory properties. Angiotensin-converting enzyme inhibitors assist in ventricular remodeling after MI. Diuretics optimize volume status and provide symptom relief in patients with heart failure.
Heart Failure
Heart failure is defined as “a complex clinical syndrome that results from any structural or functional impairment of ventricular filling or ejection of blood.”43 The underlying etiologies are numerous and include ischemia, hypertension, and diabetes. Other less common causes are valvular heart disease, infections such as viral myocarditis, toxins (alcohol, chemotherapeutic agents), and obesity.44,45
The American College of Cardiology/American Heart Association and the New York Heart Association functional classifications describe heart failure according to symptoms (Table 15-4). Heart failure can also be classified by ventricular function or ejection fraction. Heart failure with preserved ejection fraction, or diastolic heart failure, comprises those patients with an ejection fraction greater than 50% with echocardiographic evidence of abnormal diastolic function, an impairment in relaxation, and ventricular filling. The most important risk factor for diastolic heart failure is hypertension. Diastolic heart failure is more common in the elderly, female, and obese populations45,46and has now surpassed systolic heart failure as the leading class of heart failure.47 Hospitalizations for heart failure with preserved ejection fraction are increasing over time, with minimal advancement in treatment modalities.48 Risk factor modification including treatment of underlying hypertension is imperative.

Heart failure with reduced ejection fraction occurs in patients with an ejection fraction less than 40%. Patients often have concomitant diastolic dysfunction. One of the main risk factors for heart failure with reduced ejection fraction is coronary artery disease. Treatment modalities range from oral medication to intravenous inotropes to mechanical assist devices. Diuretics, angiotensin-converting enzyme inhibitors, and β blockers have been the foundation of medical management. Digoxin provides symptom relief and decreases hospital admissions, although it has no mortality benefit.49 It can be useful in patients with associated atrial fibrillation to control heart rate. Patients with decompensated systolic heart failure may require acute positive inotropic therapy with milrinone, dobutamine, or epinephrine. More invasive methods to support the failing ventricle include intraaortic balloon counterpulsation, ventricular assist devices, and cardiac transplantation.50,51
Valvular Heart Disease
Aortic Stenosis
Aortic stenosis is the most common valvular heart disease in elderly patients. It occurs as the trileaflet aortic valve calcifies with age, with congenitally bicuspid aortic valves in a younger patient population, or secondary to rheumatic heart disease. Symptoms usually develop when the valve area is less than 1 cm2, considered within the severely stenotic range. The typical presentation is either chest pain, syncope, or dyspnea (i.e., heart failure) at which time patients are estimated to have a 5-, 3-, or 2-year 50% mortality, respectively.52 Other conditions that may resemble aortic stenosis include hypertrophic cardiomyopathy, supravalvular stenosis, or subaortic membrane. The ventricle usually hypertrophies as a compensatory response to the increased afterload of the stenotic orifice, and diastolic dysfunction is a common finding. Even with normal coronary arteries, patients are at risk for subendocardial ischemia due to the severity of LVH. Hemodynamic optimization of these patients, especially during induction of anesthesia, includes maintaining adequate preload, a higher MAP, and lower heart rate. This allows more time for ventricular filling in the noncompliant heart while maintaining acceptable systemic perfusion to compensate for the increased transvalvular pressure gradient and relatively fixed CO.
Aortic Insufficiency
Aortic insufficiency can develop acutely or be more chronic in nature. Acute aortic insufficiency can be a result of trauma, endocarditis, or dissection. The pathophysiology of the two entities differs given that with chronic regurgitation, the ventricle has time to compensate by dilating and increasing diastolic compliance. This does not occur if the regurgitation occurs acutely. Aortic regurgitation in type A aortic dissection can be due to annular and aortic root dilation, asymmetric cusp coaptation due to pressure from a false lumen, flail aortic cusp due to annular disruption, or prolapse of the intimal flap through the valve (Fig. 15-19).53 Acute, severe aortic insufficiency results in severe elevation in LV end diastolic pressure and can cause presystolic closure of mitral valve during diastole, diastolic mitral regurgitation, acute pulmonary edema, and heart failure.53

Chronic aortic insufficiency is characterized by volume and pressure overload of the left ventricle. Class I indications for surgery for severe aortic insufficiency include an ejection fraction of less than 50%, symptoms related to aortic insufficiency, and patients undergoing cardiac surgery for another reason.54,55 Patients with chronic aortic insufficiency often have a dilated LV cavity as a result of volume overload, and surgery is a reasonable consideration in asymptomatic patients with an LV end diastolic dimension of greater than 65 mm or an LV end systolic dimension of greater than 50 mm (class II recommendation).55
Mitral Stenosis
Mitral stenosis is most often due to rheumatic heart disease, although it can be congenital or degenerative as well. With rheumatic mitral stenosis, thickening and fusion of the mitral commissures and leaflets and chordal thickening leads to a restricted orifice. Symptoms related to mitral stenosis are secondary to volume and pressure overload of the pulmonary circulation due to a fixed obstruction to LV filling. The LV end diastolic and ESVs are lower compared to a normal heart due to the left atrial–LV pressure gradient. Hemodynamic goals include avoiding tachycardia, which further decreases diastolic filling time. Any factors that further increase pulmonary hypertension should be avoided.
Mitral Regurgitation
Etiologies of mitral valve regurgitation include degenerative, rheumatic, congenital, and disorders related to coronary artery disease, endocarditis, or trauma. Characterizing the mechanism of mitral regurgitation, when severe, helps decide whether repair or replacement is feasible.56 Mitral regurgitation can be a result of annular dilation, excessive leaflet motion (prolapse or flail), or restricted leaflet motion. The Carpentier classification describes the mechanisms of various types of mitral regurgitation.57 Carpentier class I refers to functional mitral regurgitation related to a dilated annulus, class II refers to excessive leaflet motion in which the regurgitant jet is directed away from the degenerative leaflet, class III refers to restricted leaflet motion in which the regurgitant jet is ipsilateral to the effected leaflet or central in the case of bileaflet restriction (Fig. 15-20). Class IIIa is restricted leaflet motion involving the subvalvular apparatus (chordae and papillary muscles) seen in rheumatic heart disease. Class IIIb is restricted leaflet motion that often accompanies ischemic heart disease, in which the subvalvular apparatus is unaffected though ventricular wall motion may be compromised. Traditionally, mitral repair with preservation of the chordal apparatus has been favored over replacement, with evidence of decreased mortality and improvement of ejection fraction, although some more recent studies have suggested otherwise.58–61

Indications for surgical intervention in valvular heart disease include the following considerations: the presence of symptoms, the severity of the valvular lesion, the response of the ventricles to the volume and pressure overload, the effects of this overload on the pulmonary and systemic circulations, and the development of arrhythmias related to the lesions.55 Patient comorbidities may make percutaneous procedures more favorable. The development and the transcatheter aortic valve implantation (TAVI) procedures, for example, offer an alternative to open heart surgery in those patients with aortic stenosis deemed to be high risk for operative intervention with similar mortality and reduction of symptoms.62–65
Cardiac Dysrhythmias
During the perioperative period, changes may take place that trigger cardiac dysrhythmias. It is important to monitor for arrhythmias throughout this time, as they may cause hemodynamic instability and increase morbidity and mortality. The incidence varies according to the type of surgery, morphology of arrhythmia, the form of monitoring (continuous vs. intermittent), and the patient’s history. A multicenter study with 17,201 patients undergoing a variety of procedures concluded that 70.2% had dysrhythmias (bradycardia, tachycardia, other arrhythmias) and 1.6% of these needed treatment.66 Bertrand et al.67reported an incidence of 84% and noted that arrhythmias presented more often during the endotracheal intubation and extubation phases. Atlee68 reported in patients undergoing cardiothoracic surgery, the incidence of some arrhythmia may exceed 90% with continuous monitoring. Melduni et al.69reported it ranges from 4% to 20% for noncardiothoracic surgeries.
Etiology
Perioperative cardiac dysrhythmias are most likely to occur in patients with preexisting heart disease (coronary artery disease, valvular heart disease, or cardiomyopathies). Transient physiologic imbalances during the perioperative period make the heart more susceptible to abnormalities in the automaticity of pacemaker cells, the excitability of myocardial cells, and the conduction of the cardiac impulse.
Factors that may contribute to such imbalances include the following:
• Laryngoscopy, endotracheal intubation, ischemia, and release of catecholamines
• Electrolyte abnormalities, hypoxia, carbon dioxide levels, and pH changes
• Inhalation anesthetics, succinylcholine, anticholinesterase–anticholinergic combination reversal, most 5-HT3 antagonists, droperidol, domperidone, and antiarrhythmics may prolong the QT interval and trigger arrhythmias.
• Extensive blockade of the sympathetic system by subarachnoid local anesthetics may produce bradyarrhythmias and prolong the QT interval.70
• Ketamine due to its cardiovascular-stimulating properties
• Direct stimulation of the heart during cardiothoracic procedures and catheter insertion or stimulation of the autonomic nervous system (vagal response)
Mechanisms of Arrhythmia
Automaticity
Automaticity of the heart is its ability to spontaneously generate an electrical impulse to initiate contraction. Any cell of the cardiac conduction system can trigger its own action potential and act as a pacemaker, including cells in the SA node, the AV node, and specialized conducting fibers of the atria and ventricles. Normally, the highest rate of spontaneous depolarization occurs in the SA node, making it the dominant pacemaker in the heart. Abnormal automaticity of any part of the conduction system can lead to arrhythmias.
The resting membrane potential of the pacemaker cells is −60 to −70 mV, whereas in the cardiac muscle cells, it is −90 mV. When the membrane voltage reaches this threshold negative charge, reduction of the potassium efflux and slow influx of sodium (funny current) and calcium (T-type calcium channels) occur. This leads to the initiation of spontaneous depolarization during phase 4 of the cardiac action potential. Because this phase corresponds to diastole, it is also called diastolic depolarization. When the threshold potential is achieved (−40 mV), phase 0 is triggered mostly through activation of L-type calcium channels. Repolarization occurs during phase 3 when the potassium channels open and calcium channels close. Efflux of potassium causes the return to the resting membrane potential. Once a cell depolarizes, it is no longer excitable, being refractory to all stimuli. After this absolute refractory period, cardiac cells enter a relative refractory period during which only a greater than normal stimuli can cause cardiac cell membranes to depolarize (Fig. 15-21).

Excitability
Excitability is the ability of the cardiac cell to respond to a stimulus by depolarizing. A measure of excitability is the difference between the resting transmembrane potential and the threshold potential of the cell. The smaller the difference between these potentials, the more excitable or irritable is the cell. Therefore, enhanced automaticity occurs if the threshold potential becomes more negative or the resting membrane potential less negative. The opposite happens in hyperpolarization (Fig. 15-22). Acetylcholine released from M2 receptors during parasympathetic stimulation increases the conductance of the slow potassium channels (the outward flux of potassium). This causes hyperpolarization of the resting membrane potential and increases the membrane potential difference necessary to overcome in order to reach the threshold potential, decreasing excitability. Acetylcholine also decreases the conductance of the sodium channels (influx of sodium), which leads to slower depolarization and decreased automaticity.71Sympathetic stimulation though β1 receptors increases the conductance of the sodium channels resulting in the depolarization threshold potential being reached more quickly and increased heart rate.

Ectopic Pacemaker
An ectopic pacemaker (abnormal focus) manifests as a premature contraction of the heart that occurs between normal beats. A depolarization wave spreads outward from the ectopic pacemaker and initiates the premature contraction. The ectopic pacemaker may become persistent and assume the role of the dominant pacemaker in place of the SA node. The AV node and the bundle of His are the most common areas for the presence of an ectopic pacemaker. Impulses generated outside the SA node follow a different pathway in the conduction system (usually slower) generating a change in the configuration of the QRS wave on the ECG.
Types of Dysrhythmias
A systematic approach in reading the ECG is essential for accurate diagnosis and correct treatment. It is important to determine the rate and rhythm, the appearance of the P waves and their relation to the QRS, and the morphology of the QRS complex (Table 15-5).

Heart Block
Heart block may occur at the SA node, the AV node, or the bundle branches. Causes of heart block include ischemia, age-related degeneration of the conduction system, drug-induced depression of the impulse propagation (digitalis, β-adrenergic antagonists), excessive parasympathetic nervous system stimulation, pressure on the conduction system by atherosclerotic plaques, or direct stimulation of heart by devices, such wires and catheters.
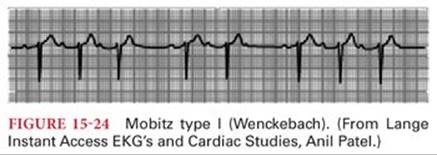
First-degree AV heart block is considered to be present when there is still one-to-one AV conduction but the P-R interval is longer than 0.2 second at a normal heart rate (Fig. 15-23). Second-degree AV heart block is present when some AV conduction still is present but doesn’t occur with every beat. It is classified as Mobitz type I (Wenckebach phenomenon) (Fig. 15-24) or Mobitz type II heart block (Fig. 15-25). Wenckebach phenomenon is characterized by a progressive beat to beat prolongation of the P-R interval until conduction of the cardiac impulse is completely interrupted and a P wave is recorded without a subsequent QRS complex. After this dropped beat, the cycle is repeated. Mobitz type II heart block is the occurrence of a nonconducted atrial impulse without a prior change in the P-R interval and is considered a higher degree of AV block than Mobitz type I.


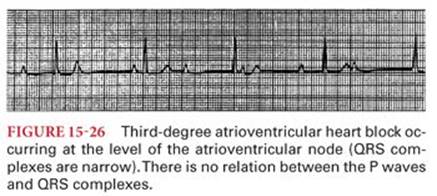
Third-degree AV heart block is present when there is no conduction of beats from the atria to the ventricles. The P waves are dissociated from the QRS complexes and the heart rate depends on the intrinsic discharge rate of the ectopic pacemaker beyond the site of conduction block. If the ectopic pacemaker is near the AV node, the QRS complexes appear normal and the heart rate is typically 40 to 60 beats per minute (Fig. 15-26). When the site of the block is infranodal, the escape ventricular pacemaker often has a discharge rate of less than 40 beats per minute and the QRS complexes are wide, resembling a bundle branch block (Fig. 15-27).

Patients may experience syncope (Stokes-Adams syndrome) at the onset of third-degree heart block, reflecting the 5- to 10-second period of asystole that may precede the initiation of an ectopic ventricular pacemaker. Occasionally, the interval of ventricular standstill at the onset of third-degree heart block is so long that death occurs. The treatment of patients with third-degree heart block usually requires insertion of a permanent artificial cardiac pacemaker. Temporary support may be provided with intravenous infusion of isoproterenol (chemical cardiac pacemaker) or a transvenous artificial cardiac pacemaker. The safe perioperative management of patients with implanted rhythm control devices such as pacemakers and implantable cardioverter defibrillators (ICD) requires a basic understanding of the classification, function, and emergency management of these devices.72,73
Bundle Branch Block
Blockage of the impulse conduction through the right or left bundle branches results in delay of activation of the corresponding ventricle, called bundle branch block, which may be complete or incomplete. Hemiblock or fascicular block refers to the blockade of either the anterior or posterior fascicle of the left bundle branch. Left bundle branch block is clinically significant and cardiac disease must be ruled out. Right bundle branch is commonly seen in healthy individuals but may be caused by right heart enlargement from conditions such as atrial septal defect, chronic lung disease, or pulmonary embolism.
Electrocardiographic criteria for complete right bundle branch block (Fig. 15-28) include QRS duration longer than 120 milliseconds, “M-shaped” QRS complex in V1 and V2 (RSR’), and slurred S wave in I, aVL, and V5 and V6. Complete left bundle brunch block (LBBB) (Fig. 15-29) is characterized by QRS longer than 120 milliseconds, M-shaped QRS (RSR’) complex in V6, and QS or RS in V1.


Reentry
A reentry circuit is the most likely mechanism for supraventricular tachycardia, atrial flutter, atrial fibrillation, premature ventricular contractions, ventricular tachycardia, and ventricular fibrillation. Reentry (circus movements) occurs when the same cardiac impulse returns to its site of initiation through a circuitous pathway and reexcites the cardiac tissue74 (Fig. 15-30). This contrasts with automaticity, where each beat is initiated by a new impulse. Reentry circuits can develop at any place in the heart where there is an imbalance between conduction and refractoriness creating a slow and fast pathway. Causes of this imbalance include elongation of the conduction pathway such as occurs in dilated hearts (especially a dilated left atrium associated with mitral stenosis), decreased velocity of conduction of cardiac impulses as occurs with myocardial ischemia or hyperkalemia, and a shortened refractory period of cardiac muscle as produced by epinephrine or electric shock from an alternating current. Each of these conditions creates a situation in which cardiac impulses conducted by normal Purkinje fibers can return retrograde through abnormal Purkinje fibers that are not in a refractory state (a reentry circuit). Reentry circuits can be eliminated by speeding conduction through normal tissues so cardiac impulses reach their initial site of origin when the fibers are still refractory or by prolonging the refractory period of normal cells so the returning impulses cannot reenter.

Preexcitation Syndrome
A preexcitation syndrome is present when atrial impulses bypass the AV node through an abnormal conduction pathway to produce premature excitation of the ventricle. Normally, the ventricles are protected from rapid atrial rates by the refractory period of the AV node. The most common accessory conduction pathway producing a direct connection (anatomic loop) of the atrium to the ventricle is known as Kent’s bundle (usually left atrium to left ventricle) (Table 15-6).75 Conduction via this accessory pathway produces the Wolff-Parkinson-White syndrome, most often manifesting as intermittent bouts of supraventricular tachyarrhythmias. Electrocardiographic features include short P-R interval (<0.12 second), slurring of the QRS (δ wave), and widening of the QRS (>0.12 second). Patients with preexcitation who are asymptomatic or have no history of tachyarrhythmia usually do not require treatment. According to the American College of Cardiology, avoiding medications that block the conduction through the AV node is recommended, as this may lead to promote anterograde conduction through the accessory pathway.76 Medications that slow the conduction down the pathologic pathway (procainamide, flecainide) are preferred. Elimination of the pathologic conduction pathway can be achieved with radiofrequency catheter ablation.77

Sinus Tachycardia
Sinus tachycardia is usually defined as a sinus rhythm with a resting heart rate of greater than 100 beats per minute (Fig. 15-31). A common cause of sinus tachycardia is sympathetic nervous system stimulation such as may occur during a noxious stimulus in the presence of low concentrations of anesthetic drugs. Hyperthermia increases heart rate approximately 18 beats per minute for every degree Celsius increase. Other important causes of sinus tachycardia include hypoxia, hypercarbia, hypovolemia, drugs, hormones, and intrinsic cardiac abnormalities.

Sinus Bradycardia
Sinus bradycardia is usually defined as a sinus rhythm with heart rate of less than 60 beats per minute (Fig. 15-32) and may be caused by parasympathetic nervous system (vagal) stimulation of the heart. Other causes may include hypoxia, medications, and cardiac conditions. Bradycardia that occurs in physically conditioned athletes reflects the ability of their hearts to eject a greater SV with each contraction compared with the less conditioned heart.

Sinus Dysrhythmias
Sinus dysrhythmia, normal variation in the SA node rate, is present during normal breathing with heart rate (R-R intervals) varying approximately 5% during various phases of the resting breathing cycle (Fig. 15-33). During inspiration, the heart rate increases and during expiration, it decreases. This variation may increase to 30% during deep breathing. These variations in heart rate with breathing most likely reflect baroreceptor reflex activity and changes in the negative intrapleural pressures that elicit a waxing and waning Bainbridge reflex. Variation in heart rate that is not related to breathing (nonphasic sinus dysrhythmia) is abnormal and may be a result of SA node dysfunction, aging, or digitalis intoxication. In perioperative settings, sinus dysrhythmia is usually transient and often caused by autonomic nervous system imbalance as the result of an intervention (spinal or epidural anesthesia, laryngoscopy, surgical stimulation) or by the effects of drugs on the SA node.

Premature Atrial Contractions
Premature atrial contractions are recognized by an abnormal P wave and a shortened or prolonged P-R interval (Fig. 15-34). The QRS complex of the premature atrial contraction has a normal configuration. The interval between the premature atrial contraction and the succeeding contraction is not an exact multiple of the normal P-P interval (noncompensatory pause) because the SA node is reset. Premature atrial contractions are usually benign and often occur in individuals without heart disease.

Premature Nodal (Junctional) Contractions
Premature nodal contractions are characterized by the absence of normal P waves and P-R intervals preceding the QRS complexes (Fig. 15-35). The P wave may precede, follow, or be obscured by the QRS complex, as the cardiac impulse travels retrograde into the atria as it moves antegrade into the ventricles. Premature junctional contractions are less common than premature atrial and premature ventricular contractions and may be seen under normal conditions.

Nodal (Junctional) Paroxysmal Tachycardia
Nodal paroxysmal tachycardia resembles atrial paroxysmal tachycardia except P waves may precede, follow, or be obscured by the QRS complex (Fig. 15-36). It is common following heart surgery. Other causes include ischemia and digitalis intoxication.

Atrial Paroxysmal Tachycardia
Atrial paroxysmal tachycardia, which often occurs in otherwise healthy young individuals, is caused by rapid rhythmic discharges of impulses from an ectopic atrial pacemaker. The rhythm on the ECG is regular and the P waves are abnormal, often inverted, indicating a site of origin other than the SA node (Fig. 15-37). The QRS complex is narrow. The rapid discharge rate of this ectopic focus causes it to become the pacemaker. Typically, the onset of atrial paroxysmal tachycardia is abrupt and may end just as suddenly with the pacemaker shifting back to the SA node. Atrial paroxysmal tachycardia may be terminated by parasympathetic nervous system stimulation of the heart with drugs or by carotid sinus massage. Drugs that increase refractoriness of the AV node (adenosine, calcium channel blockers, β blockers) are preferred initial therapy for any narrow QRS paroxysmal supraventricular tachycardia.

Atrial Fibrillation
Atrial fibrillation is characterized by normal QRS complexes occurring at a rapid and irregularly irregular rate in the absence of identifiable P waves (Fig. 15-38). The irregular ventricular response reflects arrival of atrial impulses at the AV node at times that may or may not correspond to the refractory period of the node from a previous discharge. SV is decreased during atrial fibrillation due the loss of atrial contraction, which may contribute up to 30% to 40% in ventricular filling depending on the ventricular diastolic status and heart rate.

A pulse deficit (heart rate by palpation is less than that of the ECG) reflects the inability of each ventricular contraction to eject a sufficient SV to produce a detectable peripheral pulse. Etiology of atrial fibrillation includes autonomic nervous system stimulation, ischemia, electrolyte imbalance, atrial dilation, infiltration or fibrosis, hyperthyroidism, hypertension, and sleep apnea. There is an estimated 5% annual risk of thromboembolism in patients with atrial fibrillation who are not treated with anticoagulants. Treatment includes rate control therapy, direct current cardioversion, pharmacologic cardioversion (flecainide, dofetilide, propafenone, ibutilide, and amiodarone), catheter ablation, and surgical Maze procedure. Patients with persistent atrial fibrillation should be considered for anticoagulation to prevent left atrial clot and thromboembolism.78,79 The following medications are used for rate control: β blockers, nondihydropyridine calcium channel antagonists (verapamil, diltiazem), digoxin, and amiodarone.
Atrial Flutter
Atrial flutter is a regular contraction of the atria at a rate of 250 to 300 beats per minute and on the ECG is characterized by 2:1, 3:1, or 4:1 conduction of atrial impulses to the ventricle (Fig. 15-39). This occurs because the functional refractory period of Purkinje fibers and ventricular muscle is such that no more than 200 impulses per minute can be transmitted to the ventricles. The P waves have a characteristic saw-toothed appearance, especially in leads II, III, aVF, and V1. Atrial flutter is seen commonly in patients with chronic pulmonary disease, dilated cardiomyopathy, myocarditis, ethanol intoxication, and thyrotoxicosis. This dysrhythmia may last minutes to hours before changing to sinus rhythm or atrial fibrillation. Treatment is similar to that of atrial fibrillation.

Premature Ventricular Contractions
Premature ventricular contractions result from reentry or an ectopic pacemaker in the ventricles and are not preceded by a P wave. They are classified as unifocal or multifocal based on the morphology of the QRS depending on the number of sites of initiation. The QRS complex of the ECG is widened because the cardiac impulse is conducted through the slowly conducting muscle of the ventricle or an abnormal conduction pathway (Fig. 15-40). The voltage of the QRS complex of the premature ventricular contraction is increased, reflecting the absence of the usual neutralization that occurs when a normal cardiac impulse passes through both ventricles simultaneously. The T wave of premature ventricular contractions usually has an electrical potential opposite that of the QRS complex. A compensatory pause after a premature ventricular contraction occurs because the next impulse from the SA node reaches the ventricle during its refractory period. When a premature ventricular contraction occurs, the ventricle may not have adequately filled to produce a detectable pulse. The subsequent pulse, however, may be increased due to added ventricular filling that occurs during the compensatory pause that typically follows a premature ventricular contraction.
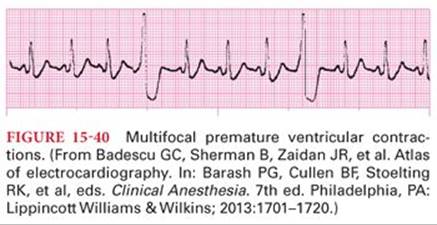
Premature ventricular contractions often reflect significant cardiac disease. For example, myocardial ischemia may be responsible for initiation of premature ventricular contractions from an irritable site in poorly oxygenated ventricular muscle. Other causes include valvular heart disease, high-catecholamine state, hypoxia, hypercapnia, cocaine, alcohol, caffeine, electrolyte abnormalities, and medications. Treatment of premature ventricular contractions includes removal of trigger factors, β blockers, calcium channel blockers, lidocaine, amiodarone, and radiofrequency ablation depending on the symptoms.
Ventricular Tachycardia
Ventricular tachycardia on the ECG resembles a series of ventricular premature contractions that occur at a rapid (200 to 300 beats per minute) and regular rate (Fig. 15-41). It is classified as monomorphic or polymorphic and predisposes to ventricular fibrillation. Common causes of ventricular tachycardia are myocardial ischemia, cardiomyopathies (dilated, hypertrophic, arrhythmogenic right ventricular cardiomyopathy), electrolyte abnormalities (potassium, magnesium, calcium), conditions that result in QT prolongation, drug toxicity, and congenital myocardial defects. SV is often severely depressed during ventricular tachycardia because the ventricles have insufficient time for cardiac filling. Presentation may include palpitations, shortness of breath, chest pain, presyncope, syncope, and sudden cardiac arrest causing death.80

Nonsustained ventricular tachycardia may be defined as three or more consecutive ventricular beats at a rate greater than 100 beats per minute lasting less than 30 seconds and is usually asymptomatic.81Sustained ventricular tachycardia usually leads to hemodynamic instability and necessitates termination with electrical cardioversion. Therapies include correction of electrolyte abnormalities, ICD placement, β blockers (sotalol, amiodarone), ablation, and revascularization.80
Ventricular Fibrillation
Ventricular fibrillation is characterized on the ECG by an irregular wavy line with voltages that range from 0.25 to 0.5 mV (Fig. 15-42). There is total absence of coordinated contractions with cessation of any effective pumping activity and disappearance of detectable pulse and systemic blood pressure. Ventricular fibrillation is usually initiated by a reentry mechanism. The only effective treatment of ventricular fibrillation is the delivery of direct electric current through the ventricles (defibrillation), which simultaneously depolarizes all ventricular muscle. This depolarization allows the initiation of a cardiac pacemaker remote from the irritable focus responsible for the ventricular fibrillation. Cardiopulmonary resuscitation (CPR) must be initiated until a defibrillator becomes available. The survival rate of ventricular fibrillation may decrease by 7% to 10 % for every minute that defibrillation is delayed, depending on the CPR quality. If defibrillation is delayed for more than 12 minutes, the survival rate is less than 5%.82 It is important to identify the patients at risk for ventricular fibrillation and place a prophylactic ICD.80

References
1. Strandring S, ed. Gray’s Anatomy: The Anatomical Basis of Clinical Practice. 40th ed. Philadelphia, PA: Churchill Livingstone; 2008.
2. Peebles CR, Shambrook JS, Harden SP. Pericardial disease—anatomy and function. Br J Radiol. 2011;84(3, special issue):S324–S337.
3. Tabaksblat MH, Dan G, Argulian E, et al. Anatomy and Physiology of the Pericardium. New York, NY: Springer International Publishing; 2014.
4. Ho S, McCarthy KP, Josen M, et al. Anatomic-echocardiographic correlates: an introduction to normal and congenitally malformed hearts. Heart. 2001;86(suppl 2):II3–II11.
5. Debonnaire P, Palmen M, Marsan NA, et al. Contemporary imaging of normal mitral valve anatomy and function. Curr Opin Cardiol. 2012;27(5):455–464.
6. Anderson RH, Cook AC, Hlavacek AJ, et al. Normal cardiac anatomy. In: da Cruz EM, Ivy D, Jaggers J, eds. Pediatric and Congenital Cardiology, Cardiac Surgery and Intensive Care. London, United Kingdom: Springer-Verlag; 2014.
7. Tune JD, Gorman MW, Feigl EO. Matching coronary blood flow to myocardial oxygen consumption. J Appl Physiol. 2004;97(1):404–415.
8. Ho SY, McCarthy KP, Ansari A, et al. Anatomy of the atrioventricular node and atrioventricular conduction system. Int J Bifurcat Chaos. 2003;13(12):3665–3674.
9. Saremi F, Abolhoda A, Ashikyan O, et al. Arterial supply to sinuatrial and atrioventricular nodes: imaging with multidetector CT. Radiol. 2008;246(1):99–107; discussion 108–109.
10. Goldberger E. The aVL, aVR, and aVF leads: a simplification of standard lead electrocardiography. Am Heart J. 1942;24:378–396.
11. London MJ, Hollenberg M, Wong MG, et al. Intraoperative myocardial ischemia: localization by continuous 12-lead electrocardiography. Anesthesiology. 1988;69(2):232–241.
12. Hall JE, Guyton AC. Guyton and Hall Textbook of Medical Physiology. 12th ed. Philadelphia, PA: Saunders/Elsevier; 2011.
13. Cardiac muscle. Wikipedia: The Free Encyclopedia. http://en.wikipedia.org/wiki/Cardiac_muscle. Accessed June 21, 2014.
14. Bers DM. Cardiac excitation-contraction coupling. Nature. 2002;415(6868):198–205.
15. Bers DM. Major cellular structures involved in excitation-contraction coupling. In: Bers DM, ed. Excitation-Contraction Coupling and Cardiac Contractile Force. 2nd ed. Kluwer Academic Publishers; 2001.
16. Fabiato A, Fabiato F. Calcium and cardiac excitation-contraction coupling. Ann Rev Physiol. 1979;41:473–484.
17. Mendelowitz D. Advances in parasympathetic control of heart rate and cardiac function. News Physiol Sci. 1999;14:155–161.
18. Brodde OE, Michel MC. Adrenergic and muscarinic receptors in the human heart. Pharmacol Rev. 1999;51(4):651–690.
19. Cameron VA, Ellmers LJ. Minireview: natriuretic peptides during development of the fetal heart and circulation. Endocrinology. 2003;144(6):2191–2194.
20. Schuijt MP, Danser AH. Cardiac angiotensin II: an intracrine hormone? Am J Hypertens. 2002;15(12):1109–1116.
21. Martinez A. Biology of adrenomedullin. Introduction. Microsc Res Tech. 2002;57(1):1–2.
22. Wiggers CJ. Dynamics of ventricular contraction under abnormal conditions. Circulation. 1952;5(3):321–348.
23. Khouri SJ, Maly GT, Suh DD, et al. A practical approach to the echocardiographic evaluation of diastolic function. J Am Soc Echocardiogr. 2004;17(3):290–297.
24. Pittman JA, Ping JS, Mark JB. Arterial and central venous pressure monitoring. Int Anesthesiol Clin. 2004;42(1):13–30.
25. Patterson SW, Starling EH. On the mechanical factors which determine the output of the ventricles. J Physiol. 1914;48(5):357–379.
26. Katz AM. Ernest Henry Starling, his predecessors, and the “Law of the Heart.” Circulation. 2002;106(23):2986–2992.
27. Starling E. The Arris and Bale Lectures on some points in the pathology of heart disease. Lancet. 1897;149(3835):569–572.
28. Guyton AC. Determination of cardiac output by equating venous return curves with cardiac response curves. Physiol Rev. 1955;35(1):123–129.
29. Henderson WR, Griesdale DE, Walley KR, et al. Clinical review: Guyton—the role of mean circulatory filling pressure and right atrial pressure in controlling cardiac output. Crit Care. 2010;14(6):243.
30. Burkhoff D, Mirsky I, Suga H. Assessment of systolic and diastolic ventricular properties via pressure-volume analysis: a guide for clinical, translational, and basic researchers. Am J Physiol. 2005;289(2):H501–H512.
31. Sagawa K. The end-systolic pressure-volume relation of the ventricle: definition, modifications and clinical use. Circulation. 1981;63(6):1223–1227.
32. Sagawa K, Suga H, Shoukas AA, et al. End-systolic pressure/volume ratio: a new index of ventricular contractility. Am J Cardiol. 1977;40(5):748–753.
33. Swan HJ, Ganz W, Forrester J, et al. Catheterization of the heart in man with use of a flow-directed balloon-tipped catheter. N Engl J Med. 1970;283(9):447–451.
34. Ganz W, Donoso R, Marcus HS, et al. A new technique for measurement of cardiac output by thermodilution in man. Am J Cardiol. 1971;27(4):392–396.
35. Libby P, Theroux P. Pathophysiology of coronary artery disease. Circulation. 2005;111(25):3481–3488.
36. Libby P. Inflammation in atherosclerosis. Nature. 2002;420(6917):868–874.
37. Libby P. Inflammation in atherosclerosis. Arterioscler Thromb Vasc Biol. 2012;32(9):2045–2051.
38. Jneid H, Anderson JL, Wright RS, et al; American College of Cardiology Foundation; American Heart Association Task Force on Practice Guidelines. 2012 ACCF/AHA focused update of the guideline for the management of patients with unstable angina/non–ST-elevation myocardial infarction (updating the 2007 guideline and replacing the 2011 focused update): a report of the American College of Cardiology Foundation/American Heart Association Task Force on Practice Guidelines. Circulation. 2012;126(7):875–910.
39. O’Gara PT, Kushner FG, Ascheim DD, et al. 2013 ACCF/AHA guideline for the management of ST-elevation myocardial infarction: a report of the American College of Cardiology Foundation/American Heart Association Task Force on Practice Guidelines. Circulation. 2013;127(4):e362–e425.
40. Fihn SD, Gardin JM, Abrams J, et al. 2012 ACCF/AHA/ACP/AATS/PCNA/SCAI/STS guideline for the diagnosis and management of patients with stable ischemic heart disease: a report of the American College of Cardiology Foundation/American Heart Association Task Force on Practice Guidelines, and the American College of Physicians, American Association for Thoracic Surgery, Preventive Cardiovascular Nurses Association, Society for Cardiovascular Angiography and Interventions, and Society of Thoracic Surgeons. J Am Coll Cardiol. 2012;60(24):e44–e164.
41. Fihn SD, Gardin JM, Abrams J, et al. 2012 ACCF/AHA/ACP/AATS/PCNA/SCAI/STS guideline for the diagnosis and management of patients with stable ischemic heart disease: a report of the American College of Cardiology Foundation/American Heart Association Task Force on Practice Guidelines, and the American College of Physicians, American Association for Thoracic Surgery, Preventive Cardiovascular Nurses Association, Society for Cardiovascular Angiography and Interventions, and Society of Thoracic Surgeons. Circulation. 2012;126(25):e354–e471.
42. Montalescot G, Sechtem U, Achenbach S, et al. 2013 ESC guidelines on the management of stable coronary artery disease: the Task Force on the management of stable coronary artery disease of the European Society of Cardiology. Eur Heart J. 2013;34(38):2949–3003.
43. Yancy CW, Jessup M, Bozkurt B, et al. 2013 ACCF/AHA guideline for the management of heart failure: a report of the American College of Cardiology Foundation/American Heart Association Task Force on Practice Guidelines. J Am Coll Cardiol. 2013;62(16):e147–e239.
44. Kemp CD, Conte JV. The pathophysiology of heart failure. Cardiovasc Pathol. 2012;21(5):365–371.
45. Kenchaiah S, Evans JC, Levy D, et al. Obesity and the risk of heart failure. N Engl J Med. 2002;347(5):305–313.
46. Lee DS, Gona P, Vasan RS, et al. Relation of disease pathogenesis and risk factors to heart failure with preserved or reduced ejection fraction: insights from the Framingham Heart Study of the National Heart, Lung, and Blood Institute. Circulation. 2009;119(24):3070–3077.
47. Bhuiyan T, Maurer MS. Heart failure with preserved ejection fraction: persistent diagnosis, therapeutic enigma. Curr Cardiovasc Risk Rep. 2011;5(5):440–449.
48. Steinberg BA, Zhao X, Heidenreich PA, et al. Trends in patients hospitalized with heart failure and preserved left ventricular ejection fraction: prevalence, therapies, and outcomes. Circulation. 2012;126(1):65–75.
49. Digitalis Investigation Group. The effect of digoxin on mortality and morbidity in patients with heart failure. N Engl J Med. 1997;336(8):525–533.
50. Pratt AK, Shah NS, Boyce SW. Left ventricular assist device management in the ICU. Crit Care Med. 2014;42(1):158–168.
51. Rose EA, Gelijns AC, Moskowitz AJ, et al. Long-term use of a left ventricular assist device for end-stage heart failure. N Engl J Med. 2001;345(20):1435–1443.
52. Turina J, Hess O, Sepulcri F, et al. Spontaneous course of aortic valve disease. Eur Heart J. 1987;8(5):471–483.
53. Hamirani YS, Dietl CA, Voyles W, et al. Acute aortic regurgitation. Circulation. 2012;126(9):1121–1126.
54. Bonow RO. Chronic mitral regurgitation and aortic regurgitation: have indications for surgery changed? J Am Coll Cardiol. 2013;61(7):693–701.
55. Nishimura RA, Otto CM, Bonow RO, et al. 2014 AHA/ACC guideline for the management of patients with valvular heart disease: a report of the American College of Cardiology/American Heart Association Task Force on Practice Guidelines. Circulation. 2014;129(23):e521–e643.
56. Fedak PW, McCarthy PM, Bonow RO. Evolving concepts and technologies in mitral valve repair. Circulation. 2008;117(7):963–974.
57. de Marchena E, Badiye A, Robalino G, et al. Respective prevalence of the different Carpentier classes of mitral regurgitation: a stepping stone for future therapeutic research and development. J Card Surg. 2011;26(4):385–392.
58. Acker MA, Parides MK, Perrault LP, et al. Mitral-valve repair versus replacement for severe ischemic mitral regurgitation. N Engl J Med. 2014;370(1):23–32.
59. Reece TB, Tribble CG, Ellman PI, et al. Mitral repair is superior to replacement when associated with coronary artery disease. Ann Surg. 2004;239(5):671–675; discussion 675–677.
60. Lee EM, Shapiro LM, Wells FC. Superiority of mitral valve repair in surgery for degenerative mitral regurgitation. Eur Heart J. 1997;18(4):655–663.
61. Rozich JD, Carabello BA, Usher BW, et al. Mitral valve replacement with and without chordal preservation in patients with chronic mitral regurgitation. Mechanisms for differences in postoperative ejection performance. Circulation. 1992;86(6):1718–1726.
62. Leon MB, Smith CR, Mack M, et al. Transcatheter aortic-valve implantation for aortic stenosis in patients who cannot undergo surgery. N Engl J Med. 2010;363(17):1597–1607.
63. Smith CR, Leon MB, Mack MJ, et al. Transcatheter versus surgical aortic-valve replacement in high-risk patients. N Engl J Med. 2011;364(23):2187–2198.
64. Makkar RR, Fontana GP, Jilaihawi H, et al. Transcatheter aortic-valve replacement for inoperable severe aortic stenosis. N Engl J Med. 2012;366(18):1696–1704.
65. Kodali SK, Williams MR, Smith CR, et al. Two-year outcomes after transcatheter or surgical aortic-valve replacement. N Engl J Med. 2012;366(18):1686–1695.
66. Forrest JB, Cahalan MK, Rehder K, et al. Multicenter study of general anesthesia. II. Results. Anesthesiology. 1990;72(2):262–268.
67. Bertrand CA, Steiner NV, Jameson AG, et al. Disturbances of cardiac rhythm during anesthesia and surgery. JAMA. 1971;216(10):1615–1617.
68. Atlee JL. Perioperative cardiac dysrhythmias: diagnosis and management. Anesthesiology. 1997;86(6):1397–1424.
69. Melduni RM, Koshino Y, Shen WK. Management of arrhythmias in the perioperative setting. Clin Geriatr Med. 2012;28(4):729–743.
70. Staikou C, Stamelos M, Stavroulakis E. Impact of anaesthetic drugs and adjuvants on ECG markers of torsadogenicity. Br J Anaesth. 2014;112(2):217–230.
71. Razani B. Autonomic cardiac regulation. 2010–2014. http://www.pathwaymedicine.org/autonomic-cardiac-regulation. Accessed April 25, 2014.
72. Atlee JL, Bernstein AD. Cardiac rhythm management devices (part I): indications, device selection, and function. Anesthesiology. 2001;95(5):1265–1280.
73. Atlee JL, Bernstein AD. Cardiac rhythm management devices (part II): perioperative management. Anesthesiology. 2001;95(6):1492–1506.
74. Akhtar M. Management of ventricular tachyarrhythmias. Part II. JAMA. 1982;247(8):1178–1181.
75. Wellens HJ, Brugada P, Penn OC. The management of preexcitation syndromes. JAMA. 1987;257(17):2325–2333.
76. Blomstrom-Lundqvist C, Scheinman MM, Aliot EM, et al. ACC/AHA/ESC guidelines for the management of patients with supraventricular arrhythmias—executive summary: a report of the American College of Cardiology/American Heart Association Task Force on Practice Guidelines and the European Society of Cardiology Committee for Practice Guidelines (writing committee to develop guidelines for the management of patients with supraventricular arrhythmias) developed in collaboration with NASPE-Heart Rhythm Society. J Am Coll Cardiol. 2003;42(8):1493–1531.
77. Kulig J, Koplan BA. Cardiology patient page. Wolff-Parkinson-White syndrome and accessory pathways. Circulation. 2010;122(15):e480–e483.
78. January CT, Wann LS, Alpert JS, et al. 2014 AHA/ACC/HRS guideline for the management of patients with atrial fibrillation: executive summary: a report of the American College of Cardiology/American Heart Association Task Force on Practice Guidelines and the Heart Rhythm Society [published online ahead of print March 28, 2014]. J Am Coll Cardiol.
79. Lip GY, Tse HF, Lane DA. Atrial fibrillation. Lancet. 2012;379(9816):648–661.
80. Zipes DP, Camm AJ, Borggrefe M, et al. ACC/AHA/ESC 2006 guidelines for management of patients with ventricular arrhythmias and the prevention of sudden cardiac death: a report of the American College of Cardiology/American Heart Association Task Force and the European Society of Cardiology Committee for Practice Guidelines (writing committee to develop guidelines for management of patients with ventricular arrhythmias and the prevention of sudden cardiac death): developed in collaboration with the European Heart Rhythm Association and the Heart Rhythm Society. Circulation. 2006;114(10):e385–e484.
81. Katritsis DG, Camm AJ. Nonsustained ventricular tachycardia: where do we stand? Eur Heart J. 2004;25(13):1093–1099.
82. Samson R, Berg R, Bingham R; Pediatric Advanced Life Support Task Force, International Liaison Committee on Resuscitation. Use of automated external defibrillators for children: an update. An advisory statement from the Pediatric Advanced Life Support Task Force, International Liaison Committee on Resuscitation. Resuscitation. 2003;57(3):237–243.