
Objectives
● The student understands the ionic basis of the spontaneous electrical activity of cardiac muscle cells:
● Describes how membrane potentials are created across semipermeable membranes by transmembrane ion concentration differences.
● Defines equilibrium potential and knows its normal value for potassium and sodium ions.
● States how membrane potential reflects a membrane’s relative permeability to various ions.
● Defines resting potential and action potential.
● Describes the characteristics of “fast” and “slow” response action potentials.
● dentifies the refractory periods of the cardiac cell electrical cycle.
● Defines threshold potential and describes the interaction between ion channel conditions and membrane potential during the depolarization phase of the action potential.
● Defines pacemaker potential and describes the basis for rhythmic electrical activity of cardiac cells.
● Names the important ion channels involved in the permeability alterations during the various phases of the cardiac cycle.
The student knows the normal process of cardiac electrical excitation:
● Describes gap junctions and their role in cardiac excitation.
● Describes the normal pathway of action potential conduction through the heart.
● ndicates the timing at which various areas of the heart are electrically excited and identifies the characteristic action potential shapes and conduction velocities in each major part of the conduction system.
● States the relationship between electrical events of cardiac excitation and the P, QRS, and T waves, the PR and QT intervals, and the ST segment of the electrocardiogram.
The student understands the factors that control the heart rate and action potential conduction in the heart:
● States how diastolic potentials of pacemaker cells can be altered to produce changes in the heart rate.
● Describes how cardiac sympathetic and parasympathetic nerves alter the heart rate and conduction of cardiac action potentials.
● Defines the terms chronotropic and dromotropic.
● The student understands the contractile processes of cardiac muscle cells:
● Lists the subcellular structures responsible for cardiac muscle cell contraction.
● Defines and describes the excitation-contraction process.
● Defines isometric, isotonic, and afterloaded contractions of the cardiac muscle.
● dentifies the influence of altered preload on the tensionproducing and shortening capabilities of the cardiac muscle.
● Describes the influence of altered afterload on the shortening capabilities of the cardiac muscle.
● Defines the terms contractility and inotropic state and describes the influence of altered contractility on the tension-producing and shortening capabilities of the cardiac muscle.
● Describes the effect of altered sympathetic neural activity on the cardiac inotropic state.
● States the relationships between ventricular volume and muscle length, between intraventricular pressure and muscle tension and the law of Laplace.
Cardiac muscle cells are responsible for providing the power to drive blood through the circulatory system. Coordination of their activity depends on an electrical stimulus that is regularly initiated at an appropriate rate and reliably conducted through the entire heart.
Mechanical pumping action depends on a robust contraction of the muscle cells that results in repeating cycles of tension development, shortening, and relaxation. In addition, mechanisms to adjust the excitation and contraction characteristics must be available to meet the changing demands of the circulatory system. This chapter focuses on these electrical and mechanical properties of cardiac muscle cells that underlie normal heart function.
Electrical activity of cardiac
Muscle cells
In all striated muscle cells, contraction is triggered by a rapid voltage change called an action potential that occurs on the cell membrane. Cardiac muscle cell action potentials differ sharply from those of skeletal muscle cells in 3 important ways that promote synchronous rhythmic excitation of the heart: (1) they can be self-generating; (2) they are conducted directly from cell to cell; and (3) they have long duration, which precludes fusion of individual twitch contractions. To understand these special electrical properties of the cardiac muscle and how cardiac function depends on them, the basic electrical properties of excitable cell membranes must first be examined.
Membrane Potentials
All cells have an electrical potential (voltage) across their membranes.
Such transmembrane potentials are caused by a separation of electrical charges across the membrane itself. The only way that the transmembrane potential can change is for electrical charges to move across (i.e., current to flow through) the cell membrane.
There are 2 important corollaries to this statement: (1) the rate of change of transmembrane voltage is directly proportional to the net current across the membrane; and (2) transmembrane voltage is stable (i.e., unchanging) only when there is no net current across the membrane.
Unlike a wire, current across cell membranes is not carried by electrons but by the movement of ions through the cell membrane. The 3 ions that are the most important determinants of cardiac transmembrane potentials are sodium (Na +) and calcium (Ca 2 +), which are more concentrated in the extracellular fluid than they are inside cells, and potassium (K +), which is more concentrated in intracellular than extracellular fluid. (See Appendix B for normal values of many constituents of adult human plasma.) In general, such ions are very insoluble in lipids. Consequently, they cannot pass into or out of a cell through the lipid bilayer of the membrane itself. Instead, these ions cross the membrane only via various protein structures that are embedded in and span across the lipid cell wall. There are 3 general types of such transmembrane protein structures that are involved in ion movement across the cell membrane: (1) ion channels; (2) ion exchangers; and (3) ion pumps. 1 All are very specific for particular ions. For example, a “sodium channel” is a transmembrane protein structure that allows only Na + ions to pass into or out of a cell according to the net electrochemical forces acting on Na + ions.
The subsequent discussion concentrates on ion channel operation because ion channels (as opposed to exchangers and pumps) are responsible for the resting membrane potential and for the rapid changes in membrane potential that constitute the cardiac cell action potential. Ion channels are under complex control and can be “opened,” “closed,” or “inactivated.” The net result of the status of membrane channels to a particular ion is commonly referred to as the membrane’s permeability to that ion. For example, “high permeability to sodium” implies that many of the Na + ion channels are in their open state at that instant. Precise timing of the status of ion channels accounts for the characteristic membrane potential changes that occur when cardiac cells are activated.
Figure 2-1 shows how ion concentration differences can generate an electrical potential across the cell membrane. Consider first, as shown at the top of this figure, a cell that (1) has K + more concentrated inside the cell than outside, (2) is permeable only to K + (i.e., only K + channels are open), and (3) has no initial transmembrane potential. Because of the concentration difference, K + ions (positive charges) will diffuse out of the cell. Meanwhile, negative charges, such as protein anions, cannot leave the cell because the membrane is impermeable to them. Thus, the K + efflux will make the cytoplasm at the inside surface of the cell membrane more electrically negative (deficient in positively charged ions) and at the same time make the interstitial fluid just outside the cell membrane more electrically positive (rich in positively charged ions). K + ion, being positively charged, is attracted to regions of electrical negativity. Therefore, when K + diffuses out of a cell, it creates an electrical potential across the membrane that tends to attract it back into the cell. There exists one membrane potential called the potassium equilibrium potential at which the electrical forces tending to pull K + into the cell exactly balance the concentration forces tending to drive K + out. When the membrane potential has this value, there is no net movement of K + across the membrane. With the normal concentrations of approximately 145 mM K + inside cells and 4 mM K + in the extracellular fluid, the K + equilibrium potential is roughly -90 mV (more negative inside than outside by ninehundredths of a volt). 2 A membrane that is permeable only to K + will inherently and rapidly (essentially instantaneously) develop the potassium equilibrium potential. In addition, membrane potential changes require the movement of so few ions that concentration differences between the intra- and extracellular fluid compartments are not significantly affected by the process.

Figure 2-1. Electrochemical basis of membrane potentials.
As depicted in the bottom half of Figure 2-1, similar reasoning shows how a membrane permeable only to Na + would have the sodium equilibrium potential across it. The sodium equilibrium potential is approximately +70 mV, with the normal extracellular Na + concentration of 140 mM and intracellular Na + concentration of 10 mM.
Real cell membranes, however, are never permeable to just Na + or just K +. When a membrane is permeable to both of these ions, the membrane potential will lie somewhere between the Na + equilibrium potential and the K + equilibrium potential. Just what membrane potential will exist at any instant depends on the relative permeability of the membrane to Na + and K +. The more permeable the membrane is to K + than to Na +, the closer the membrane potential will be to -90 mV. Conversely, when the permeability to Na + is high relative to the permeability to K +, the membrane potential will be closer to +70 mV. 3 A stable membrane potential that lies between the sodium and potassium equilibrium potentials implies that there is no net current across the membrane. This situation may well be the result of opposite but balanced sodium and potassium currents across the membrane.
Because of low or unchanging permeability or low concentration, roles played by ions other than Na + and K + in determining membrane potential are usually minor and often ignored. However, as discussed later, calcium ions (Ca 2 +) do participate in the cardiac muscle action potential. Like Na +, Ca 2 + is more concentrated outside cells than inside. The equilibrium potential for Ca 2 + is approximately +100 mV, and the cell membrane tends to become more positive on the inside when the membrane’s permeability to Ca 2 + rises.
Under resting conditions, most heart muscle cells have membrane potentials that are quite close to the potassium equilibrium potential. Thus, both electrical and concentration gradients favor the entry of Na + and Ca 2 + into the resting cell. Left unchecked, this slow leak of Na + and Ca 2 + into the cell and K + out of the cell would ultimately destroy the transmembrane potential. However, the very low permeability of the resting membrane to Na + and Ca 2 + (in combination with a Na +-Ca 2 + exchanger and an energy-requiring sodium-potassium pump) prevents Na + and Ca 2 + from gradually accumulating inside the resting cell. 4 ’ 5
Cardiac Muscle Cell Action Potentials
Action potentials of cells from different regions of the heart are not identical but have varying characteristics that are important to the overall process of cardiac excitation.
Some cells within a specialized conduction system have the ability to act as pacemakers and to spontaneously initiate action potentials, whereas ordinary cardiac muscle cells do not (except under unusual conditions). Basic membrane electrical features of an ordinary cardiac muscle cell and a cardiac pacemaker-type cell are shown in Figure 2-2. Action potentials from these cell types are referred to as “fast-response” and “slow- response” action potentials, respectively.
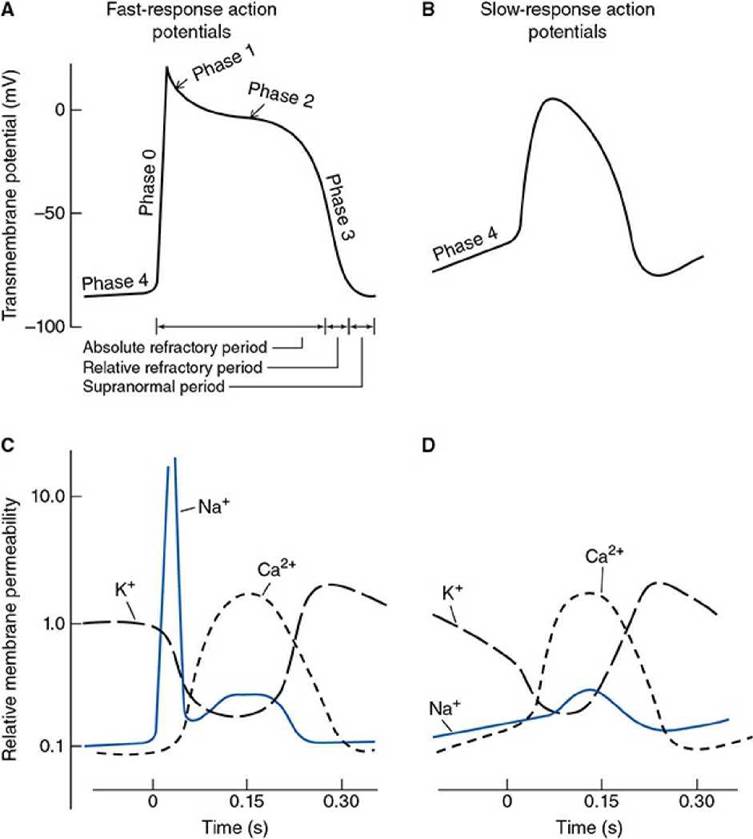
Figure 2-2. Time course of membrane potential ( A and B) and ion permeability changes ( C and D) that occur during “fast-response” ( left) and “slow-response” ( right) action potentials.
As shown in Figure 2-2A, fast-response action potentials are characterized by a rapid depolarization (phase 0) with a substantial overshoot (positive inside voltage), a rapid reversal of the overshoot potential (phase 1), a long plateau (phase 2), and a repolarization (phase 3)
to a stable, high (i.e., large negative) resting membrane potential (phase 4). In comparison, the slow-response action potentials are characterized by a slower initial depolarization phase, a lower amplitude overshoot, a shorter and less stable plateau phase, and a repolarization to an unstable, slowly depolarizing “resting” potential (Figure 2-2B). The unstable resting potential seen in pacemaker cells with slow-response action potentials is variously referred to as phase 4 depolarization, diastolic depolarization, or pacemaker potential. Such cells are usually found in the sinoatrial (SA) and atrioventricular (AV) nodes.
As indicated at the bottom of Figure 2-2A, cells are in an absolute refractory state during most of the action potential (i.e., they cannot be stimulated to fire another action potential). Near the end of the action potential, the membrane is relatively refractory and can be reexcited only by a larger-than-normal stimulus. This long refractory state precludes summated or tetanic contractions from occurring in normal cardiac muscle. Immediately after the action potential, the membrane is transiently hyperexcitable and is said to be in a “vulnerable” or “supranormal” period. Similar alterations in membrane excitability occur during slow action potentials but are not well characterized at present.
Recall that the membrane potential of any cell at any given instant depends on the relative permeability of the cell membrane to specific ions. As in all excitable cells, cardiac cell action potentials are the result of large, rapid and transient changes in the ionic permeability of the cell membrane that are triggered by an initial small, localized depolarization and then propagated over the entire cell membrane. Figure 2-2C and 2-2D indicates the changes in the membrane’s permeabilities to K+, Na+, and Ca2+ that produce the various phases of the fast- and slow-response action potentials.6 Note that during the resting phase, the membranes of both types of cells are more permeable to K+ than to Na+ or Ca2+. Therefore, the membrane potentials are close to the potassium equilibrium potential (of -90 mV) during this period.
In pacemaker-type cells, at least 3 mechanisms are thought to contribute to the slow depolarization of the membrane observed during the diastolic interval. First, there is a progressive decrease in the membrane’s permeability to K + during the resting phase. Second, the permeability to Na + increases slowly. (This gradual increase in the Na +/K + permeability ratio will cause the membrane potential to move slowly away from the K + equilibrium potential (-90 mV) in the direction of the Na + equilibrium potential.) Third, there is a slight increase in the permeability of the membrane to calcium ions late in diastole, which results in an inward movement of these positively charged ions and also contributes to the diastolic depolarization. These permeability changes result in a specific current that occurs during diastole called the i-funny ( i f) current.
When the membrane potential depolarizes to a certain threshold potential in either type of cell, major rapid alterations in the permeability of the membrane to specific ions are triggered. Once initiated, these permeability changes cannot be stopped and they proceed to completion.
The characteristic rapid rising phase of the fast-response action potential is a result of a sudden increase in Na + permeability. This produces what is referred to as the fast inward current of Na + and causes the membrane potential to move rapidly toward the sodium equilibrium potential. As indicated in Figure 2-2C, this period of very high sodium permeability (phase 0) is short-lived. A very brief increase in potassium permeability then occurs (not shown in Figure 2-2C) that allows a brief outward-going potassium current ( iTo) and results in a small nonsustained repolarization after the peak of the action potential (phase 1). Development and maintenance of a prolonged depolarized plateau state (phase 2) is accomplished by the interactions of at least 2 separate processes: (1) a sustained reduction in K + permeability and (2) a slowly developed and sustained increase in the membrane’s permeability to Ca 2 +. In addition, under certain conditions, the electrogenic action of a Na +- Ca 2 + exchanger (in which 3 Na + ions move into the cell in exchange for a single Ca 2 + ion moving out of the cell) may contribute to the maintenance of the plateau phase of the cardiac action potential.
The initial fast inward current is small (or even absent) in cells that have slow-response action potentials (Figure 2-2D). Therefore, the initial depolarization phase of these action potentials is somewhat slower than that of the fast-response action potentials and is primarily a result of an inward movement of Ca 2 + ions. In both types of cells, the membrane is repolarized (during phase 3) to its original resting potential as the K + permeability increases to its high resting value and the Ca 2 + and Na + permeabilities return to their low resting values. These late permeability changes produce what is referred to as the delayed outward current.
The overall smoothly graded permeability changes that produce action potentials are the net result of alterations in each of the many individual ion channels within the plasma membrane of a single cell. 7 These ion channels are generally made up of very long polypeptide chains that loop repeatedly across the cell membrane. These loops form a hollow conduction channel between the intracellular and extracellular fluids that are structurally quite specific for a particular ion. These channels can exist in 1 of 3 conformational states: open, closed, or inactivated. The status of the channels can be altered by configurational changes in certain subunits of the molecules within the channel (referred to as “gates” or plugs) so that when open, ions move down their electrochemical gradient either into or out of the cell (high permeability) and when closed or inactivated, no ions can move (low permeability).
The specific mechanisms that control the operation of these channels during the action potential are not fully understood. Certain types of channels are called voltage-gated channels (or voltage-operated channels) because their probability of being open varies with membrane potential. Another type of channels, called ligand-gated channels (or receptor- operated channels), are activated by certain neurotransmitters or other specific signal molecules. Table 2-1 lists a few of the major important currents and channel types involved in cardiac cell electrical activity. The number of well-described ion channels in cardiac muscle is rapidly increasing and abnormalities in these channels (channelopathies) are now known to be responsible for a variety of excitation abnormalities. Our oversimplified description of channel function below is an effort to provide some basic understanding without the many complicating features of the electrical excitation process.
Table 2-1. Characteristics of Important Cardiac Ion Channels in Order of Their Participation in an Action Potential

Some of the voltage-gated channels respond to a sudden-onset, sustained change in membrane potential by only a brief period of activation. However, changes in membrane potential of slower onset, but the same magnitude, may fail to activate these channels at all. To explain such behavior, it is postulated that a given channel has 2 independently operating “gates”—an activation gate and an inactivation gate—both of which must be open for the channel as a whole to be open. Both these gates respond to changes in membrane potential but do so with different voltage sensitivities and time courses.
These concepts are illustrated in Figure 2-3. (For simplicity, a single Na + channel and Ca 2 + channel are shown and K + channels are ignored). In the resting state, with the membrane polarized to approximately -80 mV, the activation gate of the fast Na + channel is closed, but its inactivation gate is open ( Figure 2-3A). With a rapid depolarization of the membrane to threshold, the Na + channels will be activated strongly to allow an inrush of positive sodium ions that further depolarizes the membrane and thus accounts for the rising phase of a “fast” response action potential, as illustrated in Figure 2-3B. This occurs because the activation gate responds to membrane depolarization by opening more quickly than the inactivation gate responds by closing. Thus, a small initial rapid depolarization to threshold is followed by a brief, but strong, period of Na + channel activation wherein the activation gate is open but the inactivation gate is yet to close. Within a few milliseconds, however, the inactivation gates of the fast sodium channels close and shut off the inward movement of Na +.
After a brief delay, the large membrane depolarization of the rising phase of the fast action potential causes the activation gate of the L-type Ca 2 + channel to open. This permits the slow inward movement of Ca 2 + ions, which helps maintain the depolarization through the plateau phase of the action potential ( Figure 2-3C). Ultimately, repolarization occurs because of both a delayed inactivation of the Ca 2 + channel (by closure of the inactivation gates) and a delayed opening of K + channels (which are not shown in Figure 2-3).
The inactivation gates of sodium channels remain closed during the plateau phase and the remainder of the action potential, effectively inactivating the Na + channel. This sustained sodium channel inactivation, combined with activation of calcium channels and the delay in opening of potassium channels, accounts for the long plateau phase and the long cardiac refractory period, which lasts until the end of phase 3. With repolarization, both gates of the sodium channel return to their original position and the channel is now ready to be reactivated by a subsequent depolarization.
Multiple factors in addition to membrane voltage can influence the membrane ionic permeability and normal operation of ion channels. For example, high intracellular Ca 2 + concentration during systole contributes to activation of certain K + channels and increases the rate of repolarization. Sympathetic and parasympathetic neural input can influence the status of some voltage-gated channels and cause activation or suppression of other ligand-gated channels. In addition, mechano-gated and mechano-modultated channels may be activated by myocyte stretch or myocyte volume changes and can influence membrane permeability to K +, Na +, and Ca 2 +.

Figure 2-3. A conceptual model of cardiac membrane fast sodium and slow calcium ion channels: at rest ( A), during the initial phases of the fast-response ( B and C), and the slow-response action potentials ( D and E). “Activation” gates (m and d) are hatched and “inactivation” gates (h and f) are stippled.
The slow-response action potential shown in the right half of Figure 23 differs from the fast-response action potential primarily because of the lack of a strong activation of the fast Na + channel at its onset. This accounts for the slow rate of rise of the action potential in these cells. The slow diastolic depolarization that occurs in these pacemaker-type cells is primarily a result of an inward current ( I funny) flowing through a channel that is an isoform of the family of nonselective cation hyperpolarization- activated, cyclic nucleotide-gated (HCN) channels. This channel is activated at the end of the repolarization phase and promotes a slow sodium, potassium, and calcium influx that gradually depolarizes the cells during diastole. This slow diastolic depolarization gives the inactivating h gates of many of the fast sodium channels time to close before threshold is even reached ( Figure 2-3D). Thus, in a slow-response action potential, there is no initial period where all the fast sodium channels of a cell are essentially open at once. The depolarization beyond threshold during the rising phase of the action potential in these “pacemaker” cells is slow and caused primarily by the influx of Ca 2 + through slow L-type channels (Figure 2-3E).
Although cells in certain areas of the heart typically have fast-type action potentials and cells in other areas normally have slow-type action potentials, it is important to recognize that all cardiac cells are potentially capable of having either type of action potential, depending on their maximum resting membrane potential and how fast they depolarize to the threshold potential. As we shall see, rapid depolarization to the threshold potential is usually an event forced on a cell by the occurrence of an action potential in an adjacent cell. Slow depolarization to threshold occurs when a cell itself spontaneously and gradually loses its resting polarization, which normally happens only in the SA or AV node. A chronic moderate depolarization of the resting membrane (caused, e.g., by moderately high extracellular K + concentrations of 5-7 mM) can inactivate the fast channels (by closing the h gates) without inactivating the slow L-type Ca 2 + channels. Under these conditions, all cardiac cell action potentials will be of the slow type. Large, sustained depolarizations (as might be caused by very high extracellular K + concentration such as more than 8 mM), however, can inactivate both the fast and slow channels and thus make the cardiac muscle cells completely inexcitable.
Conduction of Cardiac Action Potentials
Action potentials are initiated at a local site on a cardiac myocyte and then conducted over the surface of individual cells. This occurs because active depolarization in any one area of the membrane produces local currents that pass through the intracellular and extracellular fluids. These currents passively depolarize immediately adjacent areas of the membrane to their voltage thresholds to initiate an action potential at this new site.
In the heart, cardiac muscle cells are branching and connected end-to- end with neighboring cells at structures called intercalated disks. These disks contain the following: (1) firm mechanical attachments between adjacent cell membranes by proteins called adherins in structures called desmosomes and (2) low-resistance electrical connections between adjacent cells through channels formed by proteins called connexin in structures called gap junctions. Figure 2-4 shows schematically how these gap junctions allow action potential propagation from cell to cell.
Cells B, C, and D are shown in the resting phase with more negative charges inside than outside. Cell A is shown in the plateau phase of an action potential and has more positive charges inside than outside. Because of the gap junctions, electrostatic attraction can cause a local current flow (ion movement) between the depolarized membrane of active cell A and the polarized membrane of resting cell B, as indicated by the arrows in the figure. This ion movement depolarizes the membrane of cell B. Once the local currents from active cell A depolarize the membrane of cell B near the gap junction to the threshold level, an action potential will be triggered at that site and will be conducted over cell B. Because cell B branches (a common morphological characteristic of cardiac muscle fibers), its action potential will evoke action potentials on cells C and D. This process is continued through the entire myocardium. Thus, an action potential initiated at any site in the myocardium will be conducted from cell to cell throughout the entire heart.
The speed at which an action potential propagates through a region of cardiac tissue is called the conduction velocity. The conduction velocity varies considerably in different areas in the heart and is determined by 3 variables. (1) The diameter of the muscle fiber involved. Thus, conduction over small-diameter cells in the AV node is significantly slower than conduction over large-diameter cells in the ventricular Purkinje system. (2) The intensity of the local depolarizing currents, which are in turn directly determined by the rate of rise of the action potential. Rapid action potential depolarization favors rapid conduction to the neighboring segment or cell. (3) The capacitive and/or resistive properties of the cell membranes, gap junctions, and cytoplasm. Electrical characteristics of gap junctions can be influenced by external conditions that promote phosphorylation or dephosphorylation of the connexin proteins.
Details of the overall consequences of the variable cardiac conduction
rates are shown in Figure 2-5. As noted earlier, specific electrical adaptations of various cells in the heart are reflected in the characteristic shape of their action potentials that are shown in the right half of Figure 25. Note that the action potentials shown in Figure 2-5 have been positioned to indicate the time when the electrical impulse that originates in the SA node reaches other areas of the heart. Cells of the SA node act as the heart’s normal pacemaker and determine the heart rate. This is because the slow spontaneous diastolic depolarization of the membrane is normally most rapid in SA nodal cells, and therefore, the cells in this region reach their threshold potential and fire before cells elsewhere.

Figure 2-4. Local currents and cell-to-cell conduction of cardiac muscle cell action potentials.
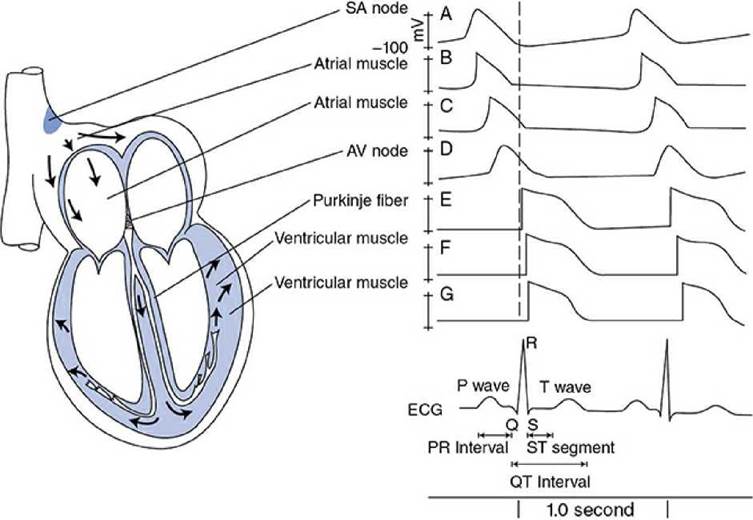
Figure 2-5. Time records of electrical activity at different sites in the heart wall: single-cell voltage recordings (traces A to G) and lead II electrocardiogram.
The action potential initiated by an SA nodal cell first spreads progressively throughout the branching and interconnected cardiac muscle cells of the atrial wall. Action potentials from cells in 2 different regions of the atria are shown in Figure 2-5: one close to the SA node and one more distant from the SA node. Both cells have similarly shaped fast responsetype action potentials, but their temporal displacement reflects the fact that it takes some time for the impulse to spread over the atria. As shown in Figure 2-5, action potential conduction is greatly slowed as it passes through the AV node. This is because of the small size of the AV nodal cells and the slow rate of rise of their action potentials. Since the AV node delays the transfer of the cardiac excitation from the atria to the ventricles, atrial contraction can contribute to ventricular filling before the ventricles begin to contract. Note also that AV nodal cells have a faster spontaneous depolarization during the diastolic period than other cells of the heart except those of the SA node. For this reason, the AV node is sometimes referred to as a latent pacemaker, and in many pathological situations, it (rather than the SA node) controls the heart rhythm. This situation is referred to as a “nodal” rhythm as distinguished from the normal “sinus” rhythm.
Because of sharply rising action potentials and other factors, such as large cell diameters, electrical conduction is extremely rapid in Purkinje fibers. This allows the Purkinje system to transfer the cardiac impulse to cells in many areas of the ventricle nearly in unison. Action potentials from muscle cells in 2 areas of the ventricle are shown in Figure 2-5. Because of the high conduction velocity in ventricular tissue, there is only a small discrepancy in their time of onset. Note in Figure 2-5 the ventricular cells that are the last to depolarize have shorter-duration action potentials and thus are the first to repolarize. The physiological importance of this behavior is not clear, but it does have an influence on the electrocardiograms discussed in Chapter 4.
Electrocardiogram (ECG aka EKG)
Fields of electrical potential caused by the electrical activity of the heart extend through the extracellular fluid of the body and can be measured with electrodes placed on the body surface. Electrocardiography provides a record of how the voltage between 2 points on the body surface changes with time as a result of the electrical events of the cardiac cycle. At any instant of the cardiac cycle, the electrocardiogram indicates the net electrical field that is the summation of many weak electrical fields being produced by voltage changes occurring on individual cardiac cells at that instant. When a large number of cells are simultaneously depolarizing or repolarizing, large voltages are observed on the electrocardiogram. Because the electrical impulse spreads through the heart tissue in a consistent pathway, the temporal pattern of voltage change recorded between 2 points on the body surface is also consistent and repeats itself with each heart cycle.
The lower trace of Figure 2-5 represents a typical recording of the voltage changes normally measured between the right arm and the left leg as the heart goes through 2 cycles of electrical excitation; this record is called a lead II electrocardiogram and is discussed in detail in Chapter 4. The major features of an electrocardiogram are indicated on this record and include the P wave, the PR interval, the QRS complex, the QT interval, the ST segment, and the T wave. The P wave corresponds to atrial depolarization; the PR interval to the conduction time through the atria and AV node; the QRS complex to ventricular depolarization; the ST segment to the plateau phase of ventricular action potentials; the QT interval to the total duration of ventricular systole; and the T wave to ventricular repolarization. (See Chapters 4 and 5 for further information about electrocardiograms.)
Control of Heart Beating Rate
Normal rhythmic contractions of the heart occur because of spontaneous electrical pacemaker activity (automaticity) of cells in the SA node. The interval between heartbeats (and thus the heart rate) is determined by how long it takes the membranes of these pacemaker cells to spontaneously depolarize during the diastolic interval to the threshold level. The SA nodal cells fire at a spontaneous or intrinsic rate (≈100 beats/min) in the absence of any outside influences. Outside influences are required, however, to increase or decrease automaticity from its intrinsic level.

Figure 2-6. The effect of sympathetic and parasympathetic activity on cardiac pacemaker potentials.
The 2 most important outside influences on automaticity of SA nodal cells come from the autonomic nervous system. Fibers from both the sympathetic and parasympathetic divisions of the autonomic system terminate on cells in the SA node, and these fibers can modify the intrinsic heart rate. Activating the cardiac sympathetic nerves (increasing cardiac sympathetic tone) increases the heart rate. Increasing the cardiac parasympathetic tone slows the heart rate. As shown in Figure 2-6, both the parasympathetic and sympathetic nerves influence the heart rate by altering the course of spontaneous diastolic depolarization of the resting potential in SA pacemaker cells.
Cardiac parasympathetic fibers, which travel to the heart through the vagus nerves, release the transmitter substance acetylcholine on SA nodal cells. Acetylcholine increases the permeability of the resting membrane to K + and decreases the diastolic i f current flowing through the HCN channels. 8 As indicated in Figure 2-6, these changes have 2 effects on the resting potential of cardiac pacemaker cells: (1) they cause an initial hyperpolarization of the resting membrane potential by bringing it closer to the K + equilibrium potential and (2) they slow the rate of spontaneous depolarization of the resting membrane. Both of these effects increase the time between beats by prolonging the time required for the resting membrane to depolarize to the threshold level. Because there is normally some continuous tonic activity of cardiac parasympathetic nerves, the normal resting heart rate is approximately 70 beats/min which is significantly slower than the intrinsic rate of ~100 beats/min.
Sympathetic nerves release the transmitter substance norepinephrine on cardiac cells. In addition to other effects discussed later, norepinephrine acts on SA nodal cells to increase the inward currents ( i f) carried by Na + and by Ca 2 + through the HCN channels during the diastolic interval. 9 These changes will increase the heart rate by increasing the rate of diastolic depolarization as shown in Figure 2-6.
In addition to sympathetic and parasympathetic nerves, there are many (albeit usually less important) factors that can alter the heart rate. These include a number of ions, circulating hormones, and various drugs as well as physical influences such as body temperature and atrial wall stretch. All act by altering the time required for the resting membrane to depolarize to the threshold potential. An abnormally high concentration of Ca 2 + in the extracellular fluid, for example, tends to decrease the heart rate by shifting the threshold potential. Factors that increase the heart rate are said to have a positive chronotropic effect. Those that decrease the heart rate have a negative chronotropic effect.
Besides their effect on the heart rate, autonomic fibers also influence the conduction velocity of action potentials through the heart. Increases in sympathetic activity increase conduction velocity (have a positive dromotropic effect), whereas increases in parasympathetic activity decrease conduction velocity (have a negative dromotropic effect). These dromotropic effects are primarily a result of autonomic influences on the initial rate of depolarization of the action potential and/or influences on conduction characteristics of gap junctions between cardiac cells. These effects are most notable at the AV node and influence the duration of the PR interval of the ECG.
Mechanical activity of the heart
Contraction of the cardiac muscle cell is initiated by a membrane action potential acting on intracellular organelles to evoke tension generation and/or shortening of the cell. In this section, we describe (1) the subcellular processes involved in coupling the excitation to the contraction of the cell (EC coupling) and (2) the mechanical properties of cardiac cells.
Cardiac Muscle Cell Contractile Apparatus
Basic histological features of cardiac muscle cells are quite similar to those of skeletal muscle cells. These shared features include:
(1) An extensive myofibrillar structure made up of parallel interdigitating thick and thin filaments arranged in serial units called sarcomeres, which are responsible for the mechanical processes of shortening and tension development. Proteins making up the thick and thin filaments are collectively referred to as “contractile proteins.”
The thick filament consists of a protein called myosin, which has a long straight tail with 2 globular heads each of which contains an ATP-binding site and an actin-binding site; light chains are loosely associated with the myosin heads and their phosphorylation may regulate (or modulate) actin binding.
The thin filament consists of several proteins including actin—2 a- helical strands of polymerized subunits (g-actin) extending from the Z lines. Sites along the actin filament interact with the heads of myosin molecules to make deformable cross-bridges with the thick filaments. Thin filaments also contain tropomyosin—a regulatory fibrous-type protein lying in the groove of the actin a-helix, which prevents actin from interacting with myosin when the muscle is at rest; and troponin —a regulatory protein consisting of 3 subunits ( troponin C, which binds calcium ions during activation and initiates the configurational changes in the regulatory proteins that expose the actin site for crossbridge formation; troponin T, which anchors the troponin complex to tropomyosin; and troponin I, which participates in the inhibition of actin-myosin interaction at rest).
The giant macromolecule, titin, extends from the Z disk to the M line in the middle of each sarcomere and provides a continuous filament network in the sarcomeres extending the length of the cell. It contributes significantly to the passive stiffness of cardiac muscle over its normal working range. Phosphorylation of titin can alter the passive elastic properties of cardiac muscle.
(2) A complex internal compartmentation of the myocyte cytoplasm by an intracellular membrane system called the sarcoplasmic reticulum (SR). This compartment actively sequesters calcium during the resting phase with the help of the sarco/endoplasmic reticulum Ca 2 +- ATPase (SERCA) and calcium-binding storage proteins within the SR, the most abundant of which is calsequestrin.
(3) Regularly spaced, extensive invaginations of the cell membrane (sarcolemma), called T tubules. These structures carry the action potential signal to the inner parts of the cell and appear to be connected to parts of the SR (“junctional” SR) by dense strands (“feet”).
There are some morphological features that are unique to cardiac muscle cells. The most obvious of these is the large number of mitochondria in the cytoplasm that provide the oxidative phosphorylation pathways needed to ensure a ready supply of adenosine triphosphate (ATP) to meet the very high metabolic needs of the cardiac muscle. Students are encouraged to consult current histological references for specific cellular morphological details.

Figure 2-7. Excitation-contraction coupling, sarcomere shortening, and relaxation.
Excitation-Contraction Coupling
Muscle action potentials trigger mechanical contraction through a process called excitation-contraction coupling, which is illustrated in Figure 2-7. The major event of excitation-contraction coupling is a dramatic rise in the intracellular free Ca 2 + concentration. The “resting” intracellular free Ca 2 + concentration is less than 0.1 pM. In contrast, during maximum activation of the contractile apparatus, the intracellular free Ca 2 + concentration may reach nearly 1.0 pM. When the wave of depolarization passes over the muscle cell membrane and down the T tubules, Ca 2 + is released from the SR into the intracellular fluid.
As indicated on the left side of Figure 2-7, the specific trigger for this release appears to be the entry of calcium into the cell via the L-type calcium channels in the t-tubules and an increase in Ca 2 + concentration just under the sarcolemma of the t-tubular system. Unlike the skeletal muscle, this highly localized increase in calcium is essential for triggering the major release of calcium from the SR. This calcium-induced calcium release is a result of opening calcium-sensitive release channels (RyR2) on the junctional SR. 10 Although the amount of Ca 2 + that enters the cell during a single action potential is quite small compared with that released from the SR, it is essential not only for triggering the SR calcium release but also for maintaining adequate levels of Ca 2 + in the intracellular stores over the long run.
When the intracellular free Ca 2 + concentration is high (>1.0 pM), links called cross-bridges form between the thick and thin filaments found within the muscle. Sarcomere units, as depicted in the lower part of Figure 2-7, are joined end-to-end at Z lines to form myofibrils, which run the length of the muscle cell. During contraction, thick and thin filaments slide past one another to shorten each sarcomere and thus the muscle as a whole. The cross-bridges form when the regularly spaced myosin heads from thick filaments attach to regularly spaced sites on the actin molecules in the thin filaments. Subsequent deformation of the bridges pulls actin molecules toward the center of the sarcomere resulting in sarcomere (and muscle) shortening. This actin-myosin interaction requires energy from ATP. In resting muscles, the attachment of myosin to the actin sites is inhibited by troponin and tropomyosin. Calcium causes muscle contraction by interacting with troponin C to cause a configurational change that removes the inhibition of the actin sites on the thin filament. Because a single cross-bridge is a very short structure, gross muscle shortening and tension development requires that cross-bridges repetitively form, produce incremental movement between the myofilaments, detach, and form again at a new actin site, and so on in a cyclic manner.
There are several processes that participate in the reduction of intracellular Ca 2 + that terminates the contraction. These processes are illustrated on the right side of Figure 2-7. Approximately 80% of this transient calcium increase is actively taken back up into the SR by the action of sarco/endoplasmic reticular calcium ATPase (SERCA) pumps located in the longitudinal part of the SR. 11 About 20% of the calcium is extruded from the cell into the extracellular fluid either via the Na +-Ca 2 + exchanger located in the sarcolemma 12 or via sarcolemmal Ca 2 +-ATPase pumps.
Excitation-contraction coupling in the cardiac muscle differs from that in the skeletal muscle in that it may be modulated, that is, different intensities of actin-myosin interaction (contraction) can result from a single action potential trigger in the cardiac muscle. The mechanism for this is largely dependent on variations in the amount of Ca 2 + reaching the myofilaments and therefore the number of cross-bridges activated during the contraction. This ability of the cardiac muscle to vary its contractile strength—that is, to change its contractility—is extremely important to cardiac function, as discussed in a later section of this chapter.
The duration of the cardiac muscle cell contraction is approximately the same as that of its action potential. Therefore, the electrical refractory period of a cardiac muscle cell is not over until the mechanical response is completed. As a consequence, heart muscle cells cannot be activated rapidly enough to cause a fused (tetanic) state of prolonged contraction. This is fortunate because intermittent contraction and full relaxation of the cardiac muscle cells is essential for the heart’s pumping action.
Cardiac Muscle Mechanics
The cross-bridge interaction that occurs after a muscle is activated gives the muscle the potential to develop force and/or shorten. Whether it does one, the other, or some combination of the two depends primarily on what is allowed to happen by the external constraints placed on the muscle during the contraction. For example, activating a muscle whose ends are held rigidly causes it to develop tension, but it cannot shorten. This is called an isometric (“fixed length”) contraction. The force that a muscle produces during an isometric contraction indicates its maximum ability to develop tension. At the other extreme, activating an unrestrained muscle causes it to shorten without force development because it has nothing to develop force against. This type of contraction is called an isotonic (“fixed tension”) contraction. Under such conditions, a muscle shortens with its maximum possible velocity (called V max), which is determined by the maximum possible rate of cross-bridge cycling. Adding load to the muscle decreases the velocity and extent of its shortening. Thus, the course of a muscle contraction depends on both the inherent capabilities of the muscle and the external constraints placed on the muscle during contraction. Muscle cells in the ventricular wall operate under different constraints during different phases of each cardiac cycle. To understand ventricular function, the manner in which the cardiac muscle behaves when constrained in several different ways must first be examined.
Isometric Contractions: Length-Tension
Relationships
The influence of muscle length on the behavior of the cardiac muscle during isometric contraction is illustrated in Figure 2-8. The top panel shows the experimental arrangement for measuring muscle force at rest and during contraction initiated at 3 different fixed lengths. The middle panel shows time records of active tension developed at each of the 3 fixed lengths in response to a single external stimulus, and the bottom panel shows a graph of how the resting and peak isometric tensions change in response to increases in the resting muscle length.
The first important fact illustrated in Figure 2-8 is that force is required to stretch a resting muscle to different lengths. This force is called the resting tension. The lower curve in the graph in Figure 2-8 shows the resting tension measured at different muscle lengths and is referred to as the resting length-tension curve. When a muscle is stimulated to contract while its length is held constant, it develops an additional component of tension called active or developed tension. The total tension exerted by a muscle during contraction is the sum of the active and resting tensions.

Figure 2-8. Isometric contractions and the effect of muscle length on resting tension and active tension development.
The second important fact illustrated in Figure 2-8 is that the active tension developed by the cardiac muscle during the course of an isometric contraction depends very much on the muscle length at which the contraction occurs. Active tension development is maximal at some intermediate length referred to as L max. Little active tension is developed at very short or very long muscle lengths. Normally, the cardiac muscle operates at lengths well below L max so that increasing muscle length increases the tension developed during an isometric contraction.
There are 3 separate mechanisms that have been proposed to explain the relationship between muscle length and developed tension. The first mechanism to be identified suggests that this relationship depends on the extent of overlap of the thick and thin filaments in the sarcomere at rest. Histological studies indicate that the changes in the resting length of the whole muscle are associated with proportional changes in the individual sarcomeres. Peak tension development occurs at sarcomere lengths of 2.2 to 2.3 pm. At sarcomere lengths shorter than approximately 2.0 pm, the opposing thin filaments may overlap or buckle and thus interfere with active tension development, as shown at the top of Figure 2-8. At long sarcomere lengths, the reduced myofilament overlap in the resting muscle cells may be insufficient for optimal cross-bridge formation during contraction.
The second (and perhaps more important) mechanism is based on a length-dependent change in sensitivity of the myofilaments to calcium. At short lengths, only a fraction of the potential cross-bridges are apparently activated by a given increase in intracellular calcium. At longer lengths, more of the cross-bridges become activated, leading to an increase in active tension development. This change in calcium sensitivity occurs immediately after a change in length with no time delay. The “sensor” responsible for the length-dependent activation of the cardiac muscle seems to reside with the troponin C molecule, but how it happens is not fully understood.
The third mechanism rests on the observation that within several minutes after increasing the resting length of the cardiac muscle, there is an increase in the amount of calcium that is released with excitation, which is coupled to a further increase in force development. It is thought that stretch-sensitive ion channels in the cell membranes may be responsible for this delayed response.
To what extent each of these mechanisms is contributing to the length dependency of cardiac contractile force at any instant is neither clear nor important in this discussion. The important point is that the dependence of active tension development on muscle length is a fundamental property of the cardiac muscle that has extremely powerful effects on heart function.
Isotonic and Afterloaded Contractions
During what is termed isotonic (“fixed load”) contraction, a muscle shortens against a constant load. A muscle contracts isotonically when it develops sufficient tension to lift a fixed weight such as the 1-g load shown in Figure 2-9. Such a 1-g weight placed on a resting muscle will result in some specific resting (initial) muscle length, which is determined by the muscle’s resting length-tension curve. If the ends of the muscle were to be fixed between 2 immoveable objects and the muscle were to be activated at this fixed length, it would contract isometrically and be capable of generating a certain amount of tension, for example, 4.5 g as indicated by the dashed line in the graph in Figure 2-9. A contractile tension of 4.5 g cannot be generated if the muscle is allowed to shorten and actually lift the 1-g weight. When a muscle has contractile potential in excess of the tension required to move the load, it will shorten. Thus, in an isotonic contraction, muscle length decreases at constant tension, as illustrated by the horizontal arrow from point 1 through point 2 to point 3 in Figure 2-9. As the muscle shortens, however, its contractile potential inherently decreases, as indicated by the downward slope of the peak isometric tension curve in Figure 2-9. There exists some short length at which the muscle is capable of generating only 1 g of tension, and when this length is reached, shortening must cease. 13 Therefore, the peak isometric curve on a cardiac muscle length-tension diagram (that indicates how much isometric tension a muscle can develop at various lengths) also establishes the limit on how far muscle shortening can proceed with different loads.

Figure 2-9. Description of isotonic and afterloaded contractions within the constraints of the cardiac muscle length-tension diagram.
Figure 2-9 also shows a complex type of muscle contraction that is typical of the way cardiac muscle cells actually contract in the heart. This is called an afterloaded isotonic contraction, in which the load on the muscle at rest (the preload) and the load on the muscle during contraction (the total load) are different. In the example of Figure 2-9, the preload is equal to 1 g, and because an additional 2-g weight (the afterload) is engaged during contraction, the total load equals 3 g.
Because preload determines the resting muscle length, both contractions shown on the right side at the top of Figure 2-9 begin from the same length. Because of the different loading arrangement, however, the afterloaded muscle must increase its total active tension to 3 g before it can shorten. This initial tension will be developed isometrically and can be represented as going from point 1 to point 4 on the length-tension diagram. Once the muscle generates enough tension to equal the total load, its tension output is fixed at 3 g and it will now shorten isotonically because its contractile potential still exceeds its tension output. This isotonic shortening is represented as a horizontal movement on the lengthtension diagram along the line from point 4 to point 5. As in any isotonic contraction, shortening must cease when the muscle’s tension-producing potential is decreased sufficiently by the length change to be equal to the load on the muscle. Note that the afterloaded muscle shortens less than the non-afterloaded muscle, even though both muscles began contracting at the same initial length. The factors that affect the extent of cardiac muscle shortening during an afterloaded contraction are of special interest to us, because, as we shall see, stroke volume is determined by how far the cardiac muscle shortens under these conditions.
Cardiac Muscle Contractility
A number of factors in addition to initial muscle length can affect the tension-generating potential of the cardiac muscle. Any intervention that increases the peak isometric tension that a muscle can develop at a fixed length is said to increase cardiac muscle contractility. Such an agent is said to have a positive inotropic effect on the heart.
The most important physiological regulator of cardiac muscle contractility is norepinephrine. When norepinephrine is released on cardiac muscle cells from sympathetic nerves, it has not only the chronotropic effect on the heart rate discussed earlier but also a pronounced, positive inotropic effect that causes cardiac muscle cells to contract more forcefully and more rapidly.
The positive effect of norepinephrine on the isometric tensiongenerating potential is illustrated in Figure 2-10A. When norepinephrine is present in the solution bathing the cardiac muscle, the muscle will, at every length, develop more isometric tension when stimulated than it would in the absence of norepinephrine. In short, norepinephrine raises the peak isometric tension curve on the cardiac muscle length-tension graph. Norepinephrine is said to increase cardiac muscle contractility because it enhances the forcefulness of muscle contraction even when initial length is constant. Changes in contractility and initial length can occur simultaneously, but by definition, a change in contractility must involve a shift from one peak isometric length-tension curve to another.

Figure 2-10. The effect of norepinephrine (NE) on isometric ( A) and afterloaded ( B) contractions of the cardiac muscle.
Figure 2-10B shows how raising the peak isometric length-tension curve with norepinephrine increases the amount of shortening in afterloaded contractions of the cardiac muscle. With preload and total load constant, more shortening occurs in the presence of norepinephrine than in its absence. This is because when contractility is increased, the tensiongenerating potential is equal to the total load at a shorter muscle length. Note that norepinephrine has no effect on the resting length-tension relationship of the cardiac muscle. Thus, norepinephrine causes increased shortening by changing the final but not the initial muscle length associated with afterloaded contractions. The added presence of norepinephrine will increase the fractional shortening (i.e., percent shortening) of cardiac muscle at any given resting length.
The cellular mechanism of the effect of norepinephrine on contractility is mediated by its interaction with a β1-adrenergic receptor. The primary signaling pathway involves an activation of the Gs protein-cAMP-protein kinase A, which then phosphorylates the Ca 2 + channel, increasing the inward calcium current during the plateau of the action potential. This increase in calcium influx not only contributes to the magnitude of the rise in intracellular Ca 2 + for a given beat but also loads the internal calcium stores, which allows more to be released during subsequent depolarizations. This increase in free Ca 2 + during activation allows more cross-bridges to be formed and greater tension to be developed (isometrically with any given preload) and more shortening to occur (isotonically with any given preload and afterload).
In addition to its effect on force development and/or shortening, norepinephrine also has 2 other important effects on the cardiac muscle cell behavior. (1) There is a norepinephrine-induced increase in the rate of muscle relaxation. This is because norepinephrine causes phosphorylation of the regulatory protein, phospholamban, on the sarcoplasmic reticular Ca 2 +-ATPase pump and the rate of calcium retrapping into the SR is enhanced. This is called a positive lusitropic effect. (2) There is a norepinephrine-induced decrease in action potential duration. This effect is achieved by a potassium channel alteration, occurring in response to elevated intracellular [Ca 2 +] that increases potassium permeability, terminates the plateau phase of the action potential, and contributes to early repolarization. Such shortening of the systolic interval by these 2 effects of norepinephrine is very helpful in the presence of elevated heart rates that might otherwise significantly compromise diastolic filling time.
Enhanced parasympathetic activity has been shown to have a small negative inotropic effect on the heart. In the atria, where this effect is most pronounced, the negative inotropic effect is thought to be due to a shortening of the action potential and a decrease in the amount of Ca 2 + that enters the cell during the action potential.
Changes in the heart rate that are not associated with autonomic neural input can also influence cardiac contractility. Recall that a small amount of extracellular Ca 2 + enters the cell during the plateau phase of each action potential. As the heart rate increases, more Ca 2 + enters the cells per minute. There is a buildup of intracellular Ca 2 + and a greater amount of Ca 2 + is released into the sarcoplasm with each action potential. Thus, a sudden increase in beating rate is followed by a progressive increase in contractile force to a higher plateau. This behavior is called the staircase phenomenon (or treppe). The importance of such rate-dependent modulation of contractility in normal ventricular function is not clear at present.
Relating cardiac muscle cell mechanics to ventricular function
Certain geometric factors dictate how the length-tension relationships of cardiac muscle fibers in the ventricular wall determine the volume and pressure relationships of the ventricular chamber. The actual relationships are complex because the shape of the ventricle is complex. The ventricle is often modeled as either a cylinder or a sphere, although its actual shape lies somewhere between the two. Because cardiac muscle cells are oriented circumferentially in the ventricular wall, either model can be used to illustrate 3 important functional points:
1. An increase in ventricular volume causes an increase in ventricular circumference and therefore an increase in the length of the individual cardiac muscle cells. Thus, the extent of diastolic filling of the ventricle is the major determinant of cardiac “preload.”
2. At any given ventricular volume, an increase in active tension of individual cardiac muscle cells in the wall causes an increase in intraventricular pressure. The intraventricular pressure that has to be developed in order to eject blood from the ventricle is largely dependent on the arterial blood pressure, which is therefore a major determinant of cardiac “afterload.”
3. As ventricular volume decreases (i.e., as the ventricular radius decreases), a lesser total (collective) active force is required by the muscle cells in the ventricular walls to produce any given intraventricular pressure (and vice versa).
The last point is a reflection of the law of Laplace that states the physical relationship that must exist between total wall tension and internal pressure in any hollow vessel with circular containing walls. Regardless of whether the ventricle is envisioned as a hollow cylinder or a hollow sphere or whether it is thick- or thin-walled, the law of Laplace says that the total wall tension ( T) depends on both intraventricular pressure ( P) and its internal radius ( r) as T = P x r.
One implication of the law of Laplace is that the muscle cells in the ventricular wall have a somewhat easier job of producing internal pressure at the end of ejection (when the radius is small) than at the beginning of ejection (when the radius is large). More importantly, the law of Laplace has important clinical relevance in pathological situations such as “cardiac dilation” and “cardiac hypertrophy.” These are discussed in detail in Chapter 11.
The importance of all these relationships will become more apparent in the subsequent chapter as we consider how cardiac muscle cell behavior determines how the heart functions as a pump.
Perspectives
It is easy to get overwhelmed by the impressive amount of information that is available concerning the excitation, contraction, and underlying biochemical processes responsible for cardiac muscle cell behavior. Our intent has been to present the basic vocabulary and essential information about excitation and contraction at the cellular level, to introduce areas of promising new information (i.e., channel function, calcium cycling, contractile processes), and perhaps to raise questions about what we don’t know (e.g., What other cellular processes besides contraction does the calcium oscillation influence? How do these cells sense and adapt to altered pre- and afterloads? How does repair of cell structures and protein synthesis occur in these constantly contracting cells?). However, at this point, we put these questions aside and hope that the student will appreciate the amazing ability of these contracting cells when assembled into a functional pump to effectively move as much as 200 million liters of blood against a substantial pressure during the course of a normal human lifetime.
Key concepts
Cardiac myocyte membrane potentials are a result of the relative permeability of the membrane to various ions and their concentration differences across the membrane.
Action potentials of cardiac myocytes have long plateau phases that generate long refractory periods and preclude summated or tetanic contractions.
Action potentials of cardiac myocytes are a result of changes in the membrane’s permeability to various ions.
Action potentials are spontaneously generated by pacemaker cells in the SA node and are conducted from cell to cell via gap junctions throughout the entire heart.
The rate of spontaneous diastolic depolarization of the SA nodal cells (and thus the heart rate) is modulated by the autonomic nervous system.
Excitation of the cardiac myocyte initiates a contraction and relaxation cycle by causing a transient increase in cytosolic calcium level that transiently activates the contractile apparatus.
Mechanical response of the myocyte depends on preload (determined by the initial resting length), afterload (determined by the tension that needs to be developed), and contractility (the degree of activation of the contractile apparatus dependent on the amount of calcium released on activation).
The cardiac myocyte length-tension relationships are correlated with changes in volume and pressure in the intact ventricle.
Study questions
2-1 Small changes in extracellular potassium ion concentrations have major effects on cell membrane potentials.
a. What will happen to the potassium equilibrium potential of cardiac muscle cells when interstitial [K +] (i.e., [K+]o ) is elevated?
b. What effect will this have on the cells’ resting membrane potentials?
c. What effect will this have on the cells’ excitability?
2-2. Cardiac survival during cardiac transplantation is improved by perfusing donor hearts with cardioplegic solutions containing approximately 20 mM KCl. Why is this high potassium concentration helpful?
2-3. There are several classes of drugs that are useful for treating various cardiac arrhythmias. Identify the primary effects of each of the following classes of drugs on cardiac myocyte characteristics:
a. What are the effects of sodium channel blockers on the PR interval of the ECG? On the duration of the QRS complex?
b. What are the effects of calcium channel blockers on the rate of firing of SA nodal cells? On the rate of conduction of the action potential through the AV node? On myocardial contractility?
c. What are the effects of potassium channel blockers on action potential duration? On refractory periods?
2-4. Very high sympathetic neural activity to the heart can lead to tetanic contraction of the cardiac muscle. True or false?
2-5. An increase in which of the following (with the others held constant) will result in an increase in the amount of active shortening of a cardiac muscle cell?
a. preload
b. afterload
c. contractility
2-6. What happens when an intervention promotes early activation of the “delayed rectifier” K + channel (IK ) in a cardiac muscle?
a. The resting potential is increased (hyperpolarized).
b. The action potential duration is decreased.
c. The action potential amplitude is decreased.
d. The action potential conduction velocity is increased.
e. The absolute refractory period is prolonged.
2-7. Action potential conduction velocity in cardiac muscle tissue is influenced by all of the following except
a. cell diameter.
b. resting membrane potential.
c. extracellular potassium concentration.
d. rate of rise (phase 0) of the action potential.
e. duration of the plateau phase (phase 2) of the action potential.
2-8. The primary route of removal of [Ca 2 + ] from the sarcoplasm during relaxation of a cardiac muscle cell is by
a. active transport out of the cell.
b. passive exchange with extracellular sodium.
c. active transport into the sarcoplasmic reticulum.
d. trapping of calcium by troponin in the myofilaments.
e. passive movement out of the cell via L-type calcium channels.
1“Channels” can be thought of as passive ion-specific holes in the membrane through which a particular ion will move according to the electrochemical forces acting on it. “Exchangers” are passive devices that couple the movement of 2 or more specific ions across the membrane according to the collective net electrochemical forces acting on all the ions involved. “Pumps” use the chemical energy of splitting ATP to move ions across the cell membrane against prevailing electrochemical forces.
2 The equilibrium potential (Eeq) for any ion (Xz) where z is the ion’s charge is determined by its intracellular and extracellular concentrations as indicated in the Nernst equation:

3 A quantitative description of how Na+ and K+ concentrations and the relative permeability  to these ions affect membrane potential (Em) is given by the following equation:

4 The sodium pump not only removes Na+ from the cell but also pumps K into the cell. Because more Na is pumped out than K is pumped in (3:2), the pump is said to be electrogenic. The resting membrane potential becomes slightly less negative than normal when the pump is abruptly inhibited.
5 The steep sodium gradient promotes Na entry into and Ca2 removal from the cytoplasm via the Na -Ca2 exchanger.
6 The membrane’s permeability to a particular ion is not synonymous with the transmembrane current of that ion. The transmembrane current of any ion is the product of the membrane’s permeability to it times the electrochemical driving forces acting on it. For example, the resting membrane is quite permeable to K + but there is little net K + movement (current flow) because the resting membrane potential is very close to the potassium equilibrium potential.
7 The experimental technique of patch clamping has made it possible to study the operation of individual ion channels. The patch clamp data indicate that a single channel is either open or closed at any instant in time; there are no graded states of partial opening. What is graded is the percentage of time that a given channel spends in the open state, and the total number of channels that are currently in an open state.
8 Acetylcholine interacts with muscarinic receptors (M2) on the SA nodal cell membrane that in turn are linked to inhibitory G proteins, Gi. The activation of Gi has 2 effects: (1) an increase in K+ conductance resulting from an increased opening of the K Ach channels; and (2) a suppression of adenylate cyclase leading to a fall in intracellular cyclic adenosine monophosphate, which reduces the inward-going pacemaker current ( i f).
9 Norepinephrine interacts with β1-adrenergic receptors on the SA nodal cell membrane that in turn are linked to stimulatory G proteins, Gs. The activation of G s increases adenylate cyclase, leading to an increase in intracellular cyclic AMP that increases the open-state probability of the HCN channel and increases the i f current.
10 These channels may be blocked by the plant alkaloid, ryanodine, acting on the RyR2 receptor (often referred to ryanodine-sensitive calcium release channels) and are activated by the methylxanthine, caffeine. These agents are chemical tools used to assess properties of these SR channels.
11 The action of these pumps is regulated by the protein phospholamban. When this protein is phosphorylated (e.g., by the action of norepinephrine), the rate of Ca 2+ resequestration by the sarcoplasmic reticulum is increased and the rate of relaxation is enhanced.
12 The Na+-Ca2+ exchanger is powered by the sodium gradient across the sarcolemma, which, in turn, is maintained by the Na+/K+-ATPase. This exchanger is electrogenic, in that 3 Na + ions move into the cell in exchange for each Ca 2+ ion that moves out. This net inward movement of positive charge may contribute to the maintenance of the plateau phase of the action potential. The cardiac glycoside, digitalis, slows down the Na +/K + pump and thus reduces the sodium gradient across the cell membrane, which, in turn, results in an increase in intracellular Ca 2+. This mechanism contributes to the positive therapeutic effect of cardiac glycosides on the contractile force of the failing heart.
13 In reality, muscle shortening requires some time and the duration of a muscle twitch contraction is limited because intracellular Ca2+ levels are elevated only briefly following the initiation of a membrane action potential. For this and possibly other reasons, isotonic shortening may not actually proceed quite as far as the isometric tension development curve on the length-tension diagram suggests is possible. Because this complication does not alter the general correspondence between a muscle’s isometric and isotonic performances, we choose to ignore it.