
Objectives
The student knows the basic electrical and mechanical events of the cardiac cycle:
● Correlates the electrocardiographic events with the mechanical events during the cardiac cycle.
● Lists the major distinct phases of the cardiac cycle as delineated by valve opening and closure.
● Describes the pressure and volume changes in the atria, the ventricles, and the aorta during each phase of the cardiac cycle.
● Defines and states normal values for (1) ventricular end-diastolic volume, end-systolic volume, stroke volume, diastolic pressure, and peak systolic pressure, and (2) aortic diastolic pressure, systolic pressure, and pulse pressure.
- States similarities and differences between mechanical events in the left and right heart pumps.
● States the origin of the heart sounds.
- Diagrams the relationship between left ventricular pressure and volume during the cardiac cycle.
The student understands the factors that determine cardiac output:
● Defines cardiac output.
● States the relationship between cardiac output, the heart rate, and stroke volume.
- Identifies the major determinants of stroke volume.
- States the Frank-Starling law of the heart.
- Predicts the effect of altered ventricular preload on stroke volume and the ventricular pressure-volume relationship.
- Predicts the effect of altered ventricular afterload on stroke volume and the ventricular pressure-volume relationship.
- Predicts the effect of altered ventricular contractility (inotropic state) on stroke volume, ejection fraction, and the ventricular pressure-volume relationship.
● Draws a family of cardiac function curves describing the relationship between filling pressure and cardiac output under various levels of sympathetic tone.
The student understands the sources of energy and the energy costs of cardiac work:
● dentifies the cardiac substrates and metabolic pathways for ATP production.
● Lists the factors that influence myocardial oxygen consumption.
The repetitive, synchronized contraction and relaxation of the cardiac muscle cells provide the forces necessary to pump blood through the systemic and pulmonary circulations. In this chapter, we describe (1) basic mechanical features of this cardiac pump, (2) factors that influence and/or regulate the cardiac output, and (3) sources of energy and energy costs required for myocardial activity.
Cardiac cycle
Left Pump
A cardiac cycle is defined as one complete sequence of cardiac filling, cardiac muscle excitation and contraction with ejection of blood and then muscle relaxation (diastole and systole). Graphs of several normal events of a single cycle of the left heart pump are plotted on the same time line in Figure 3-1. Changes in electrical activity, muscle contractions, pressures, volume, valve position, heart sounds, and aortic flow are shown so that events that are occurring simultaneously in different parts of the cycle can be assessed. This important figure summarizes a great deal of information and should be studied carefully.
Ventricular diastole
The diastolic phase 1 of the cardiac cycle begins with the opening of the atrioventricular (AV) valves. As shown in Figure 3-1, the mitral valve passively opens when left ventricular pressure falls below left atrial pressure and the period of ventricle filling begins. Blood that had previously accumulated in the atrium behind the closed mitral valve empties rapidly into the ventricle, and this causes an initial drop in atrial pressure. Later, the pressures in both chambers slowly rise together as the atrium and ventricle continue passively filling in unison with blood returning to the heart through the veins.
Proper filling of the ventricles depends on 3 conditions: (1) the filling pressure of blood returning to the heart and atria, (2) the ability of the AV valves to open fully (not be stenotic), and (3) the ability of the ventricular wall to expand passively with little resistance (i.e., to have high compliance). The healthy heart is very compliant during diastole so that filling normally occurs with only small increases in ventricular pressure.
Atrial contraction is initiated near the end of ventricular diastole by the depolarization of the atrial muscle cells, which coincides with the P wave of the electrocardiogram. As the atrial muscle cells develop tension and shorten, atrial pressure rises and an additional amount of blood is forced into the ventricle. At normal resting heart rates in healthy young individuals, atrial contraction is not essential for adequate ventricular filling. This is evident in Figure 3-1 from the fact that the ventricle has nearly reached its maximum or end-diastolic volume before atrial contraction begins. Atrial contraction plays an increasingly significant role in ventricular filling as heart rate increases because the time interval between beats for passive filling becomes progressively shorter with increased heart rate. Atrial contraction also plays a more important role as ventricular stiffness increases with age or disease.

Figure 3-1. Cardiac cycle—left heart pump. Cardiac cycle phases: A, diastole; B, systole that is divided into 3 periods; C, isovolumetric contraction; D, ejection; and E, isovolumetric relaxation.
Note that throughout diastole, atrial and ventricular pressures are nearly identical. This is because a normal open mitral valve has very little resistance to flow and thus only a very small atrial-ventricular pressure difference is necessary to produce ventricular filling.
Ventricular systole
Ventricular systole begins when the action potential passes through the AV node and sweeps over the ventricular muscle—an event heralded by the QRS complex of the electro-cardiogram. Contraction of ventricular muscle cells causes intraventricular pressure to rise above that in the atrium. Because of the valve structure, the increased pressure behind the leaflets in the ventricle causes abrupt closure of the AV valve.
Pressure in the left ventricle continues to rise sharply as ventricular contraction intensifies. When left ventricular pressure exceeds that in the aorta, the aortic valve passively opens. The period between mitral valve closure and aortic valve opening is referred to as the isovolumic (or isovolumetric) contraction phase because during this interval the ventricle is a closed chamber with a fixed volume. Ventricular ejection begins with the opening of the aortic valve. In early ejection, blood enters the aorta rapidly and causes the pressure there to rise. Pressure builds up simultaneously in both the ventricle and the aorta as the ventricular muscle cells continue to contract in early systole. This interval is often called the rapid ejection period.
Left ventricular and aortic pressures ultimately reach a maximum called peak systolic pressure. At this point, the strength of ventricular muscle contraction begins to wane. Muscle shortening and ejection continue, but at a reduced rate. Aortic pressure begins to fall because blood is leaving the aorta and large arteries faster than blood is entering from the left ventricle. Throughout ejection, very small pressure differences exist between the left ventricle and the aorta because the aortic valve orifice is so large that it presents very little resistance to flow.
Eventually, the strength of the ventricular contraction diminishes to the point where intraventricular pressure falls below aortic pressure. Because of the aortic valve structure, the increased pressure behind the leaflets in the aorta causes abrupt closure of the aortic valve. A dip, called the incisura or dicrotic notch, appears in the aortic pressure trace because a small volume of aortic blood must flow backward to fill the space behind the aortic valve leaflets as they close. 2 After aortic valve closure, intraventricular pressure falls rapidly as the ventricular muscle relaxes. For a brief interval, called the isovolumetric relaxation phase, the mitral valve is also closed. Ultimately, intraventricular pressure falls below atrial pressure, the AV valve opens, and a new cardiac cycle begins.
Note that atrial pressure progressively rises during ventricular systole because blood continues to return to the heart and fill the atrium behind the closed AV valve. The elevated atrial pressure at the end of systole promotes rapid ventricular filling once the AV valve opens to begin the next heart cycle.
The ventricle has reached its minimum or end-systolic volume at the time of aortic valve closure. The amount of blood ejected from the ventricle during a single beat, the stroke volume, is equal to ventricular end-diastolic volume minus ventricular end-systolic volume. Note that under normal conditions, the heart ejects only about 60% of its end- diastolic volume.
The aorta distends or balloons out during systole because more blood enters the aorta than leaves it. During diastole, the arterial pressure is maintained by the elastic recoil of walls of the aorta and other large arteries. Aortic pressure gradually falls during diastole as the aorta supplies blood to the systemic vascular beds. The lowest aortic pressure, reached at the end of diastole, is called arterial diastolic pressure. The difference between diastolic and peak systolic pressures in the aorta is called the arterial pulse pressure. Typical values for systolic and diastolic pressures in the aorta are 120 and 80 mm Hg, respectively.
At a normal resting heart rate of approximately 70 beats/min, the heart spends approximately two-thirds of the cardiac cycle in diastole and one- third in systole. When increases in the heart rate occur, both diastolic and systolic intervals become shorter. Action potential durations are shortened and conduction velocity is increased. Contraction and relaxation rates are also enhanced. This shortening of the systolic interval tends to blunt the potential adverse effects of increases in the heart rate on diastolic filling time.
Right Pump
Because the entire heart is served by a single electrical excitation system, similar mechanical events occur essentially simultaneously in both the left and right sides of the heart. Both ventricles have synchronous systolic and diastolic periods, and the valves of the right and left sides of the heart normally open and close nearly in unison. Because the 2 sides of the heart are arranged in series in the circulation, they must pump the same amount of blood and therefore must have identical stroke volumes.
The major difference between the right and left pumps is in the magnitude of the peak systolic pressure. The pressures developed by the right side of the heart, as shown in Figure 3-2, are considerably lower than those for the left side of the heart (Figure 3-1). This is because the lungs provide considerably less resistance to blood flow than that offered collectively by the systemic organs. Therefore, less arterial pressure is required to drive the cardiac output through the lungs than through the systemic organs. Typical pulmonary artery systolic and diastolic pressures are 24 and 8 mm Hg, respectively.
The pressure pulsations that occur in the right atrium are transmitted in retrograde fashion to the large veins near the heart. These pulsations, shown on the atrial pressure trace in Figure 3-2, can be visualized in the neck over the jugular veins in a recumbent individual. They are collectively referred to as the jugular venous pulse and can provide clinically useful information about the heart. Atrial contraction produces the first pressure peak called the a wave. The c wave, which follows shortly thereafter, coincides with the onset of ventricular systole and is caused by an initial bulging of the tricuspid valve into the right atrium. Right atrial pressure falls after the c wave because of atrial relaxation and a downward displacement of the tricuspid valve during ventricular emptying. Right atrial pressure then begins to increase toward a third peak, the v wave, as the central veins and right atrium fill behind a closed tricuspid valve with blood returning to the heart from the peripheral organs. With the opening of the tricuspid valve at the conclusion of ventricular systole, right atrial pressure again falls as blood moves into the relaxed right ventricle. Shortly afterward, right atrial pressure begins to rise once more toward the next a wave, as returning blood fills the central veins, the right atrium, and the right ventricle together during diastole.

Figure 3-2. Cardiac cycle—right heart pump.
Heart Sounds
A phonocardiographic record of the heart sounds, which occur in the cardiac cycle, is included in Figure 3-1. These sounds are normally heard by auscultation with a stethoscope placed on the chest. The first heart sound, S 1, occurs at the beginning of systole because of the abrupt closure of the AV valves, which produces vibrations of the cardiac structures and the blood in the ventricular chambers. S 1 can be heard most clearly by placing the stethoscope over the apex of the heart. Note that this sound occurs immediately after the QRS complex of the electrocardiogram.
The second heart sound, S 2, arises from the closure of the aortic and pulmonic valves at the beginning of the period of isovolumetric relaxation. This sound is heard near the end of the T wave in the electrocardiogram. The pulmonic valve usually closes slightly after the aortic valve. Because this discrepancy is enhanced during the inspiratory phase of the respiratory cycle, inspiration causes what is referred to as the physiological splitting of the second heart sound. The discrepancy in valve closure during inspiration may range from 30 to 60 ms. There are at least 2 factors that lead to this prolonged ejection time from the right ventricle during inspiration. The first is related to an inspiration-induced decrease in intrathoracic pressure and increased filling of the right side of the heart. This extra volume will be ejected, but a little extra time is required to do so. The second factor is related to the inspiration-induced decrease in pulmonary vascular resistance, which transiently reduces pulmonary artery pressure and right ventricular afterload. With reduced afterload, ventricular ejection can go on for a slightly longer period of time.
The third and fourth heart sounds, shown in Figure 3-1, are not normally present. When they are present, however, they, along with S 1 and S2, produce what are called gallop rhythms (resembling the sound of a galloping horse). When present, the third heart sound occurs shortly after S 2 during the period of rapid passive ventricular filling and, in combination with heart sounds S 1 and S 2, produces what is called ventricular gallop rhythm. Although S 3 may sometimes be detected in normal children, it is heard more commonly in patients with left ventricular failure. The fourth heart sound, which occasionally is heard shortly before S 1, is associated with atrial contraction and rapid active filling of the ventricle. Thus, the combination of S1, S2, and S4 sounds produces what is called an atrial gallop rhythm. The presence of S 4 often indicates an increased ventricular diastolic stiffness, which can occur with several cardiac disease states.
There may be other sounds associated with the cardiac cycle that usually indicate abnormal conditions. Murmurs can occur during systole or diastole and usually indicate turbulent flow through cardiac valves that either do not fully open or completely close. (These are described in more detail in Chapter 5.) Information about other abnormal sounds including rubs, snaps, and clicks can be obtained in more specific clinical references.
Cardiac Cycle Pressure-Volume and Length Tension Relationships
Intraventricular pressure and volume are intimately linked to the tension and length of the cardiac muscle cells in the ventricular wall through purely geometric and physical laws. Figure 3-3A and 3-3B shows the correspondence between a ventricular pressure-volume loop and a cardiac muscle length-tension loop during a single cardiac cycle. These 2 loops indicate that cardiac muscle length-tension behavior is the underlying basis for ventricular function. Note that in Figure 3-3, each major phase of the ventricular cardiac cycle (panel A) has a corresponding phase of cardiac muscle length and tension change (panel B). During diastolic ventricular filling, for example, the progressive increase in ventricular pressure causes a corresponding increase in muscle tension, which passively stretches the resting cardiac muscle to greater lengths along its resting length-tension curve. End-diastolic ventricular pressure is referred to as ventricular preload because it sets the end-diastolic ventricular volume and therefore the resting length of the cardiac muscle fibers at the end of diastole.
At the onset of systole, the ventricular muscle cells develop tension isometrically and intraventricular pressure rises accordingly. After the intraventricular pressure rises sufficiently to open the outlet valve, ventricular ejection begins as a consequence of ventricular muscle shortening. Systemic arterial pressure is often referred to as the ventricular afterload because it determines the tension that must be developed by cardiac muscle fibers before they can shorten. 3
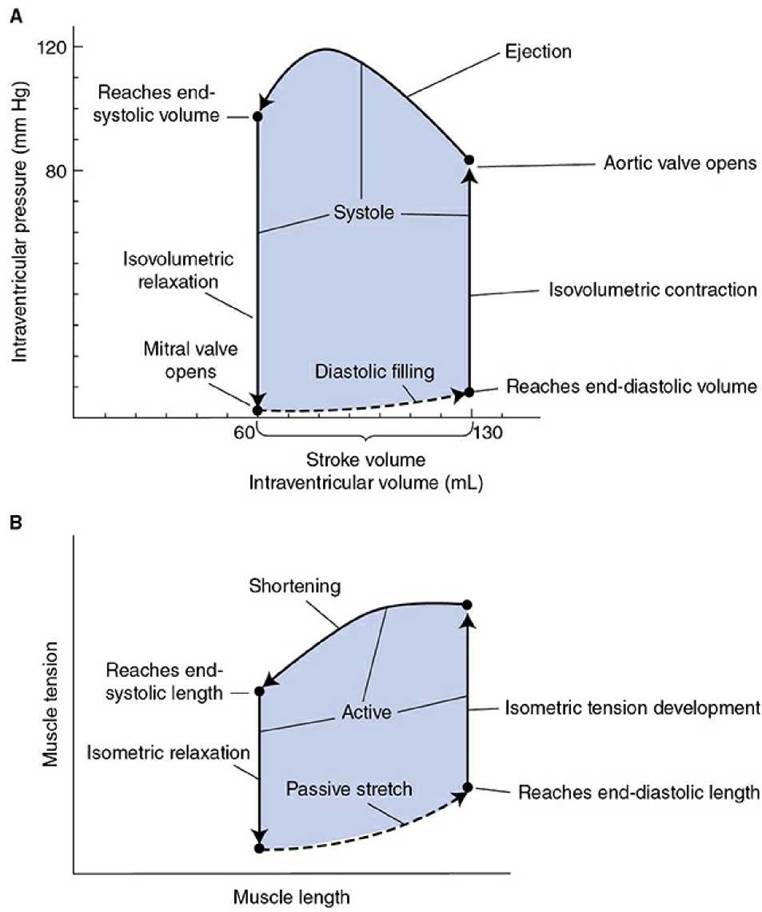
Figure 3-3. ( A) Left ventricular pressure-volume cycle and ( B) corresponding cardiac muscle length-tension cycle.
During cardiac ejection, the cardiac muscle is simultaneously generating active tension and shortening (i.e., an afterloaded isotonic contraction). The magnitude of ventricular volume change during ejection (i.e., stroke volume) is determined by how far ventricular muscle cells shorten during contraction. This, as already discussed, depends on the length-tension relationship of the cardiac muscle cells and the load against which they are shortening. Once shortening ceases and the output valve closes, the cardiac muscle cells relax isometrically. Ventricular wall tension and intraventricular pressure fall in unison during isovolumetric relaxation.
Determinants of cardiac output
Cardiac output (liters of blood pumped by each of the ventricles per minute) is an extremely important cardiovascular variable that is continuously adjusted so that the cardiovascular system operates to meet the body’s moment-to-moment transport needs. In going from rest to strenuous exercise, for example, the cardiac output of an average person will increase from approximately 5.5 to perhaps 15 L/min. The extra cardiac output provides the exercising skeletal muscles with the additional nutritional supply needed to sustain an increased metabolic rate. To understand the cardiovascular system’s response not only to exercise but also to all other physiological or pathological demands placed on it, one must understand what determines and therefore controls cardiac output.
As stated in Chapter 1, cardiac output is the product of the heart rate and stroke volume (CO = HR x SV). Therefore, all changes in cardiac output must be produced by changes in the heart rate and/or stroke volume.
Factors influencing the heart rate do so by altering the characteristics of the diastolic depolarization of the pacemaker cells, as discussed in Chapter 2 ( Figure 2-6). Recall that variations in activity of the sympathetic and parasympathetic nerves leading to cells of the sinoatrial (SA) node constitute the most important regulators of the heart rate. An increase in sympathetic activity increases the heart rate, whereas an increase in parasympathetic activity decreases the heart rate. These neural inputs have immediate effects (within 1 beat) and therefore can cause very rapid adjustments in cardiac output.
Influences on stroke volume
Effect of Changes in Ventricular Preload: The Frank-Starling Law of the Heart
The volume of blood that the heart ejects with each beat can vary significantly. One of the most important factors responsible for these variations in stroke volume is the extent of cardiac filling during diastole. This concept was introduced in Chapter 1 ( Figure 1—7) and is known as the Starling law of the heart. To review (and to reemphasize its importance), this law states that, with other factors equal, stroke volume increases as cardiac filling increases. As discussed in the following section, this phenomenon is based on the intrinsic mechanical properties of myocardial muscle.
Figure 3-4A illustrates how increasing muscle preload will increase the extent of shortening during a subsequent contraction with a fixed total load. Recall from the nature of the resting length-tension relationship that an increased preload is necessarily accompanied by increased initial muscle fiber length. As described in Chapter 2, when a muscle starts from a greater length, it has more distance to shorten before it reaches the length at which its tension-generating capability is no longer greater than the load on it. The same behavior is exhibited by cardiac muscle cells when they are actually operating in the ventricular wall. Increased ventricular preload (i.e., diastolic filling) increases both end-diastolic volume and stroke volume almost equally, as illustrated in Figure 3-4B.
The precise relationship between cardiac diastolic filling pressure and end- diastolic volume has especially important physiological and clinical consequences. Although the actual relationship is somewhat curvilinear, especially at very high filling pressures, it is nearly linear over the normal operating range of the normal heart. The low slope of this relationship indicates the substantial compliance of the normal ventricle during diastole (e.g., a change in filling pressure of only 1 mm Hg normally will change end-diastolic volume by approximately 25 mL). As will be discussed in Chapter 11, one major form of cardiac failure is called “diastolic failure” and is characterized by a low ventricular compliance and a decidedly abnormal relationship between cardiac filling pressure and end- diastolic volume. 4
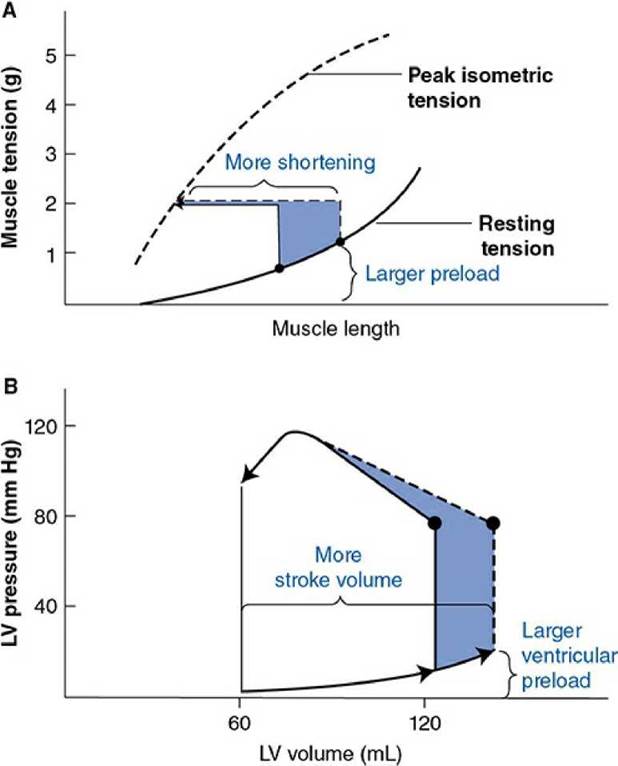
Figure 3—4. The effect of an increase in preload on ( A) cardiac muscle shortening during afterloaded contractions and ( B) ventricular stroke volume.
It should be noted in Figure 3-4A that increasing preload increases initial muscle length without significantly changing the final length to which the muscle shortens against a constant total load. Thus, increasing ventricular filling pressure increases stroke volume, primarily by increasing end-diastolic volume. As shown in Figure 3-4B, this is not accompanied by a significant alteration in end-systolic volume.
Effect of Changes in Ventricular Afterload
As stated previously, systemic arterial pressure is usually taken to be the left ventricular “afterload.” A slight complication is that arterial pressure varies between a diastolic value and a systolic value during each cardiac ejection. Usually, however, we are interested in mean ventricular afterload and take this to be mean arterial pressure.
Figure 3-5A shows how increased afterload, at constant preload, has a negative effect on cardiac muscle cell shortening. Again, this is simply a consequence of the fact that muscle cannot shorten beyond the length at which its peak isometric tension-generating potential equals the total load on it. Thus, shortening must stop at a greater muscle length when afterload is increased.
Normally, mean ventricular afterload is quite constant because mean arterial pressure is held within tight limits by the cardiovascular control mechanisms described later. In many pathological situations such as hypertension and aortic valve obstruction, however, ventricular function is adversely influenced by abnormally high ventricular afterload. When this occurs, stroke volume may be decreased, as shown by the changes in the pressure-volume loop in Figure 3-5B. Under these conditions, note that stroke volume is decreased because end-systolic volume is increased.
The relationship between end-systolic pressure and end-systolic volume obtained at a constant preload but different afterloads is indicated by the dotted line in Figure 3-5B. In a normally functioning heart, the effect of changes in afterload on end-systolic volume (and therefore stroke volume) is quite small (approximately 0.5 mL/mm Hg). However, in what is termed “systolic cardiac failure,” the effect of changes in afterload on end-systolic volume is greatly exaggerated such that a small increase in arterial pressure can significantly reduce stroke volume. Thus, the slope of this line can be used clinically to assess the systolic function of the heart, as discussed further in Chapter 11.
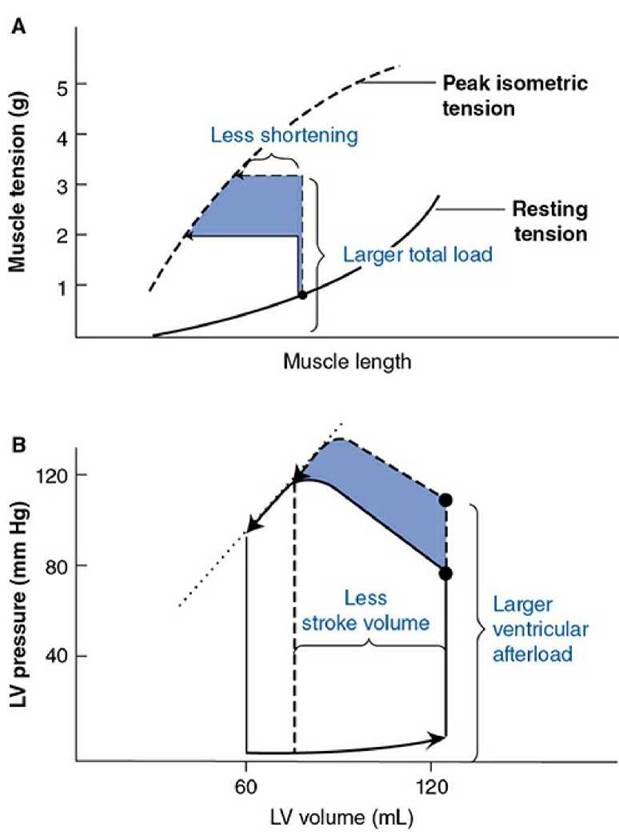
Figure 3-5. The effect of an increase in afterload on ( A) cardiac muscle shortening during afterloaded contractions and ( B) ventricular stroke volume.
Effect of Changes in Cardiac Muscle Contractility
Recall that activation of the sympathetic nervous system results in release of norepinephrine from cardiac sympathetic nerves, which increases contractility of the individual cardiac muscle cells. This results in an upward shift of the peak isometric length-tension curve. As shown in Figure 3-6A, such a shift will result in an increase in the shortening of a muscle contracting with constant preload and total load. Thus, as shown in Figure 3-6B, the norepinephrine released by sympathetic nerve stimulation will increase ventricular stroke volume by decreasing the end- systolic volume, without directly influencing the end-diastolic volume.
The term ejection fraction is a clinically useful variable used to assess cardiac muscle contractility. It is the fraction of the blood in the ventricle at the end of diastole that is ejected during systole. It is defined as the ratio of stroke volume (SV) to end-diastolic volume (EDV):

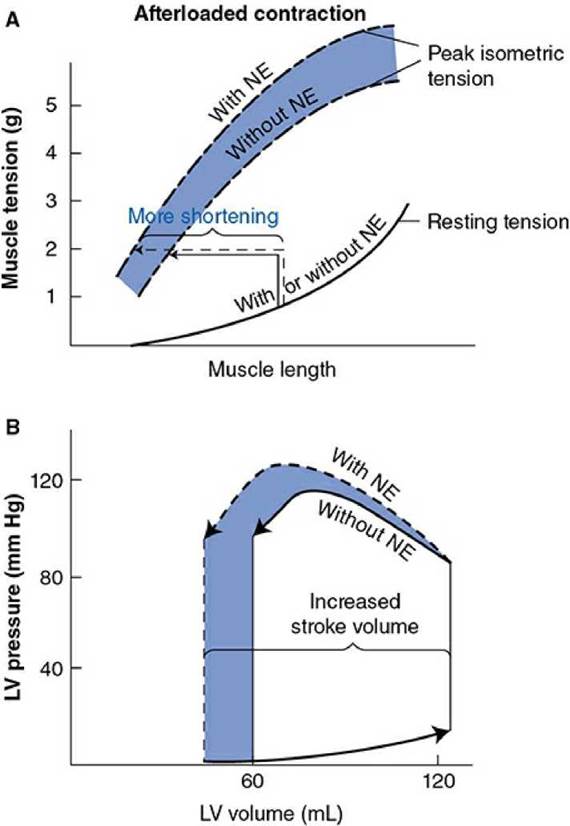
Figure 3-6. The effect of an increase in contractility by norepinephrine (NE) on ( A) cardiac muscle shortening during afterloaded contractions and ( B) ventricular stroke volume.
Because increased myocardial contractility causes an increase in ventricular ejection fraction, measurements of ejection fraction are often used clinically to assess the state of myocardial contractility. 5
In addition to this change in the extent of myocyte shortening, an increase in contractility will also cause an increase in the rates of myocyte tension development and of shortening. This will result in an increase in the rate of isovolumetric pressure development and the rate of ejection during systole.
Summary of determinants of cardiac output
The major influences on cardiac output are summarized in Figure 3-7. The heart rate is controlled by chronotropic influences on the spontaneous electrical activity of SA nodal cells. Cardiac parasympathetic nerves have a negative chronotropic effect, and sympathetic nerves have a positive chronotropic effect on the SA node. Stroke volume is controlled by influences on the contractile performance of the ventricular cardiac muscle —in particular, its degree of shortening in the afterloaded situation. The 3 distinct influences on stroke volume are contractility, preload, and afterload. Increased cardiac sympathetic nerve activity tends to increase stroke volume by increasing the contractility of the cardiac muscle. Increased arterial pressure tends to decrease stroke volume by increasing the afterload on cardiac muscle fibers. Increased ventricular filling pressure increases end-diastolic volume, which tends to increase stroke volume through the Starling law.
It is important to recognize at this point that both the heart rate and stroke volume are subject to more than one influence. Thus, the fact that increased contractility tends to increase stroke volume should not be taken to mean that, in the intact cardiovascular system, stroke volume is always high when contractility is high. Following blood loss caused by hemorrhage, for example, stroke volume may be low in spite of a high level of sympathetic nerve activity and increased contractility. The only other possible causes for low stroke volume are high arterial pressure and low cardiac filling pressure. Because arterial pressure is normal or low following hemorrhage, the low stroke volume associated with severe blood loss must be (and is) the result of low cardiac filling pressure.
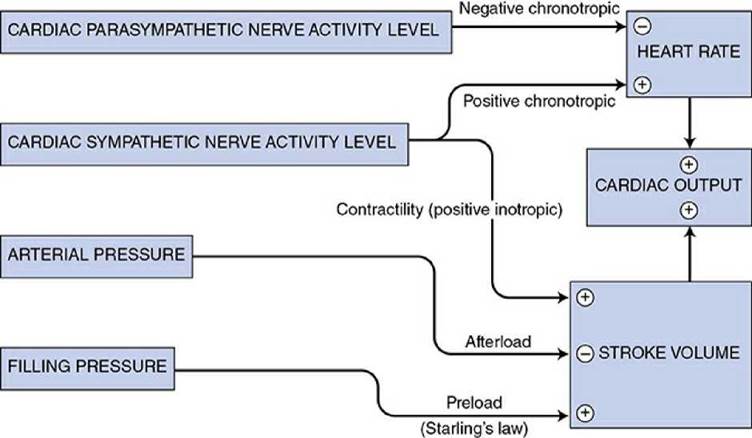
Figure 3-7. Summary of influences on cardiac output.
Cardiac Function Curves
One very useful way to summarize the influences on cardiac function and the interactions between them is by cardiac function curves such as those shown in Figure 3-8.
In this case, cardiac output is treated as the dependent variable and is plotted on the vertical axis in Figure 3-8, while cardiac filling pressure is plotted on the horizontal axis. 6
Different curves are used to show the influence of alterations in cardiac sympathetic nerve activity. Thus, Figure 3-8 shows how the cardiac filling pressure and the activity level of cardiac sympathetic nerves interact to determine cardiac output. When the cardiac filling pressure is 2 mm Hg and the activity of cardiac sympathetic nerves is normal, the heart will operate at point A and will have a cardiac output of 5 L/min. Each single curve in Figure 3-8 shows how cardiac output would be changed by changes in cardiac filling pressure if cardiac sympathetic nerve activity were held at a fixed level. For example, if cardiac sympathetic nerve activity remained normal, increasing cardiac filling pressure from 2 to 4 mm Hg would cause the heart to shift its operation from point A to point B on the cardiac function diagram. In this case, cardiac output would increase from 5 to 7 L/min solely as a result of the increased filling pressure (the Starling law). If, on the other hand, cardiac filling pressure were fixed at 2 mm Hg while the activity of cardiac sympathetic nerves was moderately increased from normal, the heart would change from operating at point A to operating at point C. Cardiac output would again increase from 5 to 7 L/min. In this instance, however, cardiac output does not increase through the length-dependent mechanism because cardiac filling pressure did not change. Cardiac output increases at constant filling pressure with an increase in cardiac sympathetic activity for 2 reasons. First and most importantly, increased cardiac sympathetic nerve activity increases the heart rate. Second, increased sympathetic nerve activity increases stroke volume by increasing cardiac contractility. 7

Figure 3-8. Influence of cardiac sympathetic nerve activity on cardiac function curves.
Cardiac function graphs thus consolidate knowledge of many mechanisms of cardiac control and are most helpful in describing how the heart interacts with other elements in the cardiovascular system. Furthermore, these graphs reemphasize the important point that a change in cardiac filling pressure alone will have a very potent effect on cardiac output at any level of sympathetic activity.
Summary of sympathetic neural influences on cardiac function
Because of its importance in overall control of cardiac function, it is appropriate at this point to summarize the major direct effects that the sympathetic nervous system exerts on electrical and mechanical properties of the cardiac muscle and thus on cardiac pumping ability. These effects are initiated by norepinephrine interaction with 0 1-adrenergic receptors on cardiac muscle cells, resulting in a cascade of events involving the G s activation of adenylate cyclase, formation of cAMP, and activation of protein kinase A with subsequent phosphorylation of many molecules that play key regulatory roles in intracellular processes. These cellular events resulting from increase in sympathetic neural activity to the heart combine to evoke improvements in pumping capabilities of the heart. These improvements include the following:
1. An increase in the heart rate (positive chronotropic effect) by activating the inward-going i f current in SA nodal cells.
2. A decrease in cardiac action potential duration by early activation of the delayed i K current in cardiac myocytes, which minimizes the detrimental effect of high heart rates on diastolic filling time.
3. An increase in the rate of action potential conduction, particularly evident in the AV node (positive dromotropic effect) by altering conductivity of gap junctions and by increasing the rate of initial depolarization of the action potential.
4. An increase in cardiac contractility (positive inotropic effect) by activating the i Ca 2+ current and increasing Ca 2+ release from the sarcoplasmic reticulum, which increases the contractile ability of the cardiac muscle at any given preload.
5. An increase in the rate of cardiac relaxation (positive lusitropic effect) by increasing Ca 2 + uptake by the sarcoplasmic reticulum, which also helps minimize the detrimental effect of high heart rates on diastolic filling time. 8 ’ 9
As will be presented in subsequent chapters, increases in sympathetic activity can have indirect influences on cardiac function that are a consequence of sympathetic-induced alterations in arteriolar and venous tone (i.e., alterations in afterload and preload, respectively). It should also be noted that increases in sympathetic drive can have negative effects on the heart primarily as a consequence of the catecholamine-induced increased metabolic demands on the heart.
Cardiac energetics
Energy Sources and Chemical Efficiency
For the heart to operate properly, it must have an adequate supply of chemical energy in the form of adenosine triphosphate (ATP). The relatively low ATP content of cardiac tissue combined with a relatively high rate of ATP hydrolysis at rest suggests that the myocardial ATP pool will completely turn over every 10 s.
The substrates from which ATP is formed by the heart depend partly on which substrates are in the greatest supply at a particular instant. For example, after a high-carbohydrate meal, the heart will take up and metabolize glucose and pyruvate, whereas between meals, the heart can switch to metabolize free fatty acids, triglycerides, and ketones. Unlike skeletal muscle, cardiac muscle can utilize lactate as an energy source, which is beneficial during strenuous exercise when skeletal muscles are producing lactate. In addition, the choice of substrate depends on the metabolic phenotype of the cardiac muscle. Fetal and newborn hearts derive most of their ATP from metabolism of glucose and lactate, whereas within a few weeks of birth a switch toward fatty acid oxidation occurs so that by adulthood 60% to 90% of cardiac ATP is derived from fatty acids. A switch back toward the fetal phenotype accompanies severe heart failure. Glycogen is stored in myocardial cells as a reserve energy supply and can be mobilized via the glycolytic pathway to provide extra substrate under conditions of increased sympathetic stimulation.
The end product of metabolism of glycogen, glucose, fatty acids, triglycerides, pyruvate, and lactate is acetyl CoA, which enters the citric acid (Krebs) cycle in the mitochondria, where, by a process of oxidative phosphorylation, the molecules are degraded to carbon dioxide and water and the energy is converted to ATP. (The student is encouraged to consult a biochemistry textbook for further details of these important metabolic pathways.)
The anaerobic sources of energy in the heart (e.g., glycolysis and creatine phosphate) are not adequate to sustain the metabolic demand for more than a few minutes. The heavy (nearly total) reliance of the heart on the aerobic pathways for ATP production is evident by (1) the high number of mitochondria and (2) the presence of high concentrations of the oxygen-binding protein myoglobin within the cardiac muscle cells. Myoglobin can release its oxygen to the mitochondrial cytochrome oxidase system when intracellular oxygen levels are lowered. In this regard, the cardiac muscle resembles “red” skeletal muscle that is adapted for sustained contractile activity as opposed to “white” skeletal muscle that is adapted for high-intensity, short-duration contractile activity.
The heart uses this chemical energy for basic “housekeeping” functions (e.g., ion pumps, repair processes) and for doing external “work” (e.g., pumping blood through the circulation). The heart’s chemical efficiency can be described as the proportion of chemical energy supplied that actually does “work,” and in normal conditions the heart operates with an impressive overall efficiency of more than 30%. (For comparison, internal combustion engines are only 20-25% efficient.) The excess expended chemical energy is lost as heat that is ultimately carried away by coronary blood flow.
Determinants of Cardiac Energy Demand: Myocardial Oxygen Consumption
Because the heart derives its energy almost entirely from aerobic metabolism, myocardial oxygen consumption is directly related to myocardial ATP production and use. Therefore, changes in myocardial oxygen consumption closely parallel changes in myocardial external work rate.
In many pathological situations, such as obstructive coronary artery disease, the oxygen requirements of the myocardial tissue may exceed the capacity of coronary blood flow to deliver oxygen to the heart muscle. It is important to understand what factors determine the energy costs and, therefore, the myocardial oxygen consumption rate because, if oxygen delivery is compromised, reduction of the oxygen demand may be of significant clinical benefit to the patient.
The basal metabolism of the heart tissue required for basic “housekeeping” functions (e.g., energy-dependent ion pumping) normally accounts for approximately 25% of myocardial ATP use and therefore 25% of myocardial oxygen consumption in a resting individual. 10 Because basal metabolism represents the energy consumed in cellular processes other than contraction, little can be done to reduce it.
The processes associated with muscle contraction account for approximately 75% of myocardial energy use. Primarily, this reflects ATP splitting associated with cross-bridge cycling during the isovolumetric contraction and ejection phases of the cardiac cycle. Some ATP is also used for Ca 2 + sequestration at the termination of each contraction.
The energy expended during the isovolumetric contraction phase of the cardiac cycle accounts for the largest portion (~50%) of total myocardial oxygen consumption despite the fact that the heart does no external work during this period. The energy needed for isovolumetric contraction depends heavily on the intraventricular pressure that must develop during this time, that is, on the cardiac afterload. Cardiac afterload then is a major determinant of myocardial oxygen consumption. Reductions in cardiac afterload can produce clinically significant reductions in myocardial energy requirements and therefore myocardial oxygen consumption.
Energy utilization during isovolumetric contraction is actually more directly related to isometric wall tension development than to intraventricular pressure development. Recall that wall tension is related to intraventricular pressure and ventricular radius through the law of Laplace ( T = P x r). Consequently, reductions in cardiac preload (i.e., end- diastolic volume and radius) will also tend to reduce the energy required for isovolumetric contraction per beat. 11
It is during the ejection phase of the cardiac cycle when the heart actually performs useful external work. The energy the heart expends during ejection depends on how much work it is doing during ejection. In a fluid system, work (force x distance) is equal to pressure (force/distance 2) x volume (distance 3). The external physical work done by the left ventricle in 1 beat, called stroke work, is equal to the area enclosed by the left ventricular pressure-volume loop (see Figure 3-3). Stroke work is increased either by an increase in stroke volume (increased “volume” work) or by an increase in afterload (increased “pressure” work). In terms of ATP utilization and oxygen consumption, increases in the pressure work of the heart are more costly than increases in volume work. Thus, reductions in afterload are especially helpful in reducing the myocardial oxygen requirements for doing external work.
Changes in myocardial contractility can have important consequences on the oxygen requirement for basal metabolism, isovolumic wall tension generation, and external work. Heart muscle cells use more energy in rapidly developing a given tension and shortening by a given amount than in doing the same thing more slowly. Also, with increased contractility, more energy is expended in active Ca 2 + transport. The net result of these influences is often referred to as the “energy wasting” effect of increased contractility.
The heart rate is one of the most important determinants of myocardial oxygen consumption because the energy cost per minute must equal the energy cost per beat times the number of beats per minute. In general, it has been found that it is more efficient (i.e., less oxygen is required) to achieve a given cardiac output with the low heart rate and high stroke volume than with the high heart rate and low stroke volume. This again appears to be related to the relatively high energy cost of the pressure development phase of the cardiac cycle.
External Work of the Heart and Mechanical Efficiency
The left heart does the work needed to pump blood through the systemic organs. For any pump, the rate of doing external work is equal to the flow it is producing times the pressure into which it is delivering flow. The output flow of the left heart is the cardiac output (CO). It delivers that flow into the aorta with an arterial pressure that has an average value over time called the mean arterial pressure (MAP). Thus, to a rough approximation, the work rate (WR) of the left heart pump can be calculated as:
WR = CO x MAP
This equation shows that the work rate of the left heart is increased by any increases in CO or MAP. One may use this equation to estimate how much work the left heart is doing per time in any given situation with a known CO and MAP. For example, a normal adult has a resting CO of about 5 L/min and a MAP of about 100 mm Hg. So, for a normal adult at rest, their left heart pump is doing work at a rate of about 500 (L x mm Hg)/min. This is the amount of energy the heart is delivering/time to the peripheral circulation. By appropriate units conversion, it can be shown that this is a work rate of about 20 calories/day. Note that with a standard recommended daily dietary caloric input of ~2000 calories, only a very small percentage of our ingested energy is needed to do the work of blood circulation in a resting individual. This observation emphasizes the fact that, under normal conditions, the cardiovascular system operates with astounding efficiency.
During heavy exercise the metabolic rate of the body may increase about 3-fold over that at rest. To sustain that increased metabolic rate, tissue blood flow (i.e., CO) must increase by roughly an equal amount. Recall from the basic flow equation ( Q = ∆P/ R) that an increase in tissue blood flow can only be caused by either an increase in Л P (i.e., MAP) or a decrease in TPR (the “ total peripheral resistance” to flow through the systemic circulation). If the 3-fold increase in flow during heavy exercise were caused solely by a 3-fold increase in MAP, both CO and MAP would each increase by 3-fold. Thus the work rate of the heart would increase 9fold over rest during heavy exercise. At the opposite extreme, if the 3-fold increase in tissue blood flow were accomplished by a decrease in systemic vascular resistance to one-third its resting value with no change in MAP, the work rate of the heart would increase only 3-fold over rest during heavy exercise. It is little wonder why our cardiovascular systems have evolved to operate very efficiently with nearly constant arterial pressure and to regulate flow by varying the vascular resistance to flow through the blood vessels within the body.
The cardiac work rate equation also has important implications for the normal overall operation of the cardiovascular system. Recall that the primary task of the cardiovascular system is to maintain homeostasis in organs throughout the body by supplying each organ with sufficient blood flow to meet its current metabolic needs. To accomplish this with a minimum effort by the heart in any given situation requires 2 things:
1. Supply each organ with just enough blood flow to meet its current needs. Collectively this minimizes the CO necessary in any situation.
2. Maintain an arterial pressure that is sufficient (but not excessive) to cause that tissue blood flow.
As will be described in detail in subsequent chapters, the first of these goals is accomplished primarily via mechanisms that operate on blood vessels to change their diameter and resistance to flow. The second goal is accomplished primarily by mechanisms that operate on the heart to appropriately adjust HR and SV so to maintain near constant arterial pressure regardless of what is happening in the periphery.
Perspectives
The job of the heart is to establish the pressure that drives blood passively through the pulmonic and systemic circulations. This is a remarkable, highly efficient, adaptable, and long-lasting pump that we, despite our best efforts, are unable to duplicate with any significant degree of success. When it breaks down, we suffer rather immediate adverse consequences.
As might be expected, support of this pump is highly dependent on maintenance of coronary flow to the ventricular wall. Much of our current medical interventions are aimed at the coronary vasculature. Description of coronary flow is presented in more detail in Chapter 7.
In this book, we have ignored the extracellular structures of the heart, that is, the fibrous valves, the connective tissue frame (cardiac skeleton) that functions to electrically isolate the atria from the ventricles, and the extracellular matrix that forms a dynamic scaffolding surrounding the contractile cells. These structures are made primarily of collagen from the fibroblasts and not only maintain the structural integrity of the heart but appear to participate importantly in dynamic adaptations to changing conditions.
Key concepts
Effective cardiac pumping of blood requires coordinated filling of the chambers, excitation and contraction of the cardiac muscle cells, pressure generation within the chambers, opening and closing of cardiac valves, and one-way movement of blood through the chambers into the aorta or pulmonary artery.
Except for lower ejection pressures, events of the right side of the heart are identical to those of the left side.
Heart sounds associated with valve movements and detected on auscultation can be used to identify the beginnings of diastolic and systolic phases of the cardiac cycle.
The events of a single ventricular cardiac cycle can be displayed as records of electrical, mechanical, pressure, sound, or flow changes against time or as a record of volume against pressure.
Cardiac output is defined as the amount of blood pumped by either of the ventricles per minute and is determined by the product of the heart rate and stroke volume.
Stroke volume can be altered by changes in ventricular preload (filling), ventricular afterload (arterial pressure), and/or cardiac muscle contractility.
Ventricular “ejection fraction” describes the fraction of end-diastolic volume of blood in the ventricle that is ejected per beat and is an index of cardiac contractility.
A cardiac function curve describes the relationship between ventricular filling and cardiac output and can be shifted up (left) or down (right) by changes in sympathetic activity to the heart or by changes in cardiac muscle contractility.
Energy for cardiac muscle contraction is derived primarily from aerobic metabolic pathways such that myocardial oxygen consumption is tightly related to cardiac work. The heart is highly efficient (>30%) at turning chemical energy into the energy of external work.
In any given situation, the heart is doing external work at a rate given by CO x MAP.
To produce an increase in tissue blood flow while minimizing the external workload of the heart, it is much more efficient to reduce tissue resistance to blood flow than to increase arterial blood pressure.
Study questions
3-1. If pulmonary artery pressure is 24/8 mm Hg (systolic/diastolic), what are the respective systolic and diastolic pressures of the right ventricle?
3-2. Which of the following interventions will increase cardiac stroke volume?
a. increased ventricular filling pressure
b. decreased arterial pressure
c. increased activity of cardiac sympathetic nerves
d. increased circulating catecholamine levels
3-3. In which direction will cardiac output change if central venous pressure is lowered while cardiac sympathetic tone is increased?
3-4. Increases in sympathetic neural activity to the heart will result in an increase in stroke volume by causing a decrease in end-systolic volume for any given end-diastolic volume. True or false?
3-5. Four of these conditions exist during the same phase of the cardiac cycle and one does not. Which one is the odd one?
a. The mitral valve is open.
b. The ST segment of the ECG is occurring.
c. Ventricular volume is increasing.
d. Aortic pressure is falling.
3-6. With all other factors equal, myocardial oxygen demands will be increased to the greatest extent by which of the following?
a. increases in the heart rate
b. increases in coronary flow
c. increases in end-diastolic volume
d. decreases in arterial pressure
e. decreases in cardiac contractility
3-7. Sympathetic neural activation of the heart will decrease which of the following?
a. heart rate
b. PR interval on the ECG
c. metabolic demands
d. coronary flow rate
e. cardiac contractility
3-8. An increase in total peripheral resistance (TPR) normally results in an increase in the external work rate required by the heart. True or false?
3-9. The metabolic requirement of the heart muscle in any situation is always equal to how much external work the heart is doing in that situation. True or false?
1 The atria and ventricles do not beat simultaneously. Usually, and unless otherwise noted, in this discussion systole and diastole denote phases of ventricular operation.
2 Some choose to identify this event as the beginning of diastole as it is easily demarked on the arterial pressure record of the mitral valve as part of ventricular systole or diastole. For clinical purposes, the incisura is a convenient and easily attainable marker of the end of ventricular ejection (but not of ventricular relaxation). The debate involves whether to include the short isovolumic relaxation period that occurs between the closure of the aortic valve and the opening of the mitral valve. We don’t care.
3 This designation is somewhat misleading for at least 3 reasons. First, arterial pressure is more analogous to ventricular total load than to ventricular afterload. Second, because of the law of Laplace, the actual wall tension that needs to be generated to attain a given intraventricular pressure also depends on the ventricular radius (tension = pressure x radius). Thus, the larger the end- diastolic volume, the greater the tension required to develop sufficient intraventricular pressure to open the outflow valve. Third, inertial factors associated with acceleration of blood flow during ejection also contribute to ventricular afterload. We choose, however, to ignore these complications.
4 This is also more commonly called “heart failure with preserved ejection fraction.”
5 Ejection fraction is commonly expressed as a percentage and normally ranges from 55% to 80% (mean 67%) under resting conditions. Ejection fractions of less than 50% to 55% indicate depressed myocardial contractility. Changes in preload and afterload can also influence ejection fraction, but can be taken into account during the clinical assessment.
6 Other variables may appear on the axes of these curves. The vertical axis may be designated as stroke volume or stroke work, whereas the horizontal axis may be designated as central venous pressure, right (or left) atrial pressure, or ventricular end-diastolic volume (or pressure). In all cases, the curves describe the relationship between preload and cardiac function.
7 Decreases in cardiac afterload (i.e., arterial pressure) can also shift the position of the curve upward by allowing more shortening to occur at a given preload. This effect is normally not important because afterload (i.e., arterial pressure) is usually kept constant.
8 Most catecholamine effects on the heart are a result of increases in sympathetic neural activity. Although circulating catecholamines of adrenal origin can potentially evoke similar effects, their concentrations are normally so low that their contributions are negligible.
9 Specific drugs called β-adrenergic receptor blockers can block all the effects of catecholamines on cardiac muscle. The drugs may be useful in the treatment of coronary artery disease to thwart increased metabolic demands placed on the heart by activity of sympathetic nerves.
10 Indeed, many of these “housekeeping” functions increase their energy demands during exercise.
11 This fact is especially important in congestive heart failure when the heart is distended and has an abnormally large ventricular radius. In this situation, the heart muscle itself will have an elevated “afterload” even when the mean arterial pressure may be normal. In a sense, reduction of the end- diastolic volume will reduce both preload and afterload.