Importance of the right ventricle (RV) in health and disease has seen a sea-change from being just a conduit to an important contractile chamber, which significantly impacts cardiac physiology, hemodynamics and development of symptoms.1 It is the final barrier between compensated versus decompensated heart. Right ventricular musculature when stressed expresses several important enzymes and activates several signal transduction pathways involved in hypertrophy, fibrosis and pulmonary vasoconstriction.2 These changes bring new meaning to pharmacotherapy of heart failure and the role of the RV. Under normal conditions, the RV is coupled with a low-impedance, highly distensible pulmonary vascular system (Figs 11.1 to 11.3).
Compared with the systemic circulation, pulmonary circulation has a much lower vascular resistance and greater pulmonary artery distensibility.3 Under normal conditions, right-sided pressures are significantly lower than comparable left-sided pressures. Despite this, the RV ejects similar or somewhat greater volume during systole compared to the left ventricle (LV) 4-6 (Figs 11.4 and 11.5).
PECULIARITIES OF THE RIGHT VENTRICLE
• The right ventricular systolic function is predominantly afterload-dependent and minimally affected by the preload.

Fig. 11.1: Schematic diagram of low impedance right heart circulation. Short-axis view.
• Unlike the LV, there is no torsion of any significance and hence hardly any circumferential shortening (Fig. 11.6).
• Radial shortening is unimpressive unlike the LV, partly because myofiber orientation and muscle volume is different (Fig. 11.7).
• Highly trabeculated and spongy appearance of the cavity allows it to work as an efficient volume pump but poses challenges with regard to geometric volume estimations7 (Fig. 11.8).

Fig. 11.2: Distribution of pulmonary artery systolic pressure in normal subjects.

Fig. 11.3: Distribution of pulmonary artery mean pressure in normal subjects. A mean pressure > 25 mm Hg indicates presence of pulmonary hypertension.

Fig. 11.4: Right ventricular pressure-volume loop.

Fig. 11.5: Comparison of pressure-volume loop of the right ventricle (yellow) with that of the left ventricle (white).
• Presence of a transverse moderator band prevents undue chamber dilatation and hence despite significant combined pressure and volume overload in heart failure, it is not uncommon to see minimum geometric alterations.8 This makes eye-balling highly deceptive in assessing right ventricular function (Fig. 11.9).
• In advanced diseased states, outflow may become a dominant contractile chamber by virtue of its circumferential muscle orientation. Little attention has been given to the importance of this phenomenon (Figs 11.10 and 11.11).
Function of the RV is to transmit blood from the venous
system to the LV through pulmonary arteries.
• As normal adult circulation is in series, right ventricular stroke volume is nearly similar to that of the LV.
• If we assume the RV as a mechanical pump, function is its behavior in developing pressure at varying volumes during cardiac cycle.9
• ttere are phases in cardiac cycle, which have variable functional importance and temporal dimension needs to be coupled with a mechanical event for complete

Fig. 11.6: Right ventricular basal circumferential strain of only -4% in a normal subject. Paradoxically, many segments show circumferential lengthening.

Fig. 11.7: Comparison of basal right ventricular radial strain (10%) with the left ventricular basal radial strain (55%) in a normal subject.

Fig. 11.8: Transthoracic echocardiography short-axis view showing spongy right ventricle.

Fig. 11.9: The right ventricle is a tripartite structure with an inflow part including the tricuspid valve apparatus; a trabecular part that includes pronounced trabeculations that function as an absorptive sponge, filling during diastole and releasing blood in systole; and an outflow tract that consists of a muscular infundibulum, separating the tricuspid from the pulmonary valve.

Fig. 11.10: Conceptual diagram. The two contractile chambers of the right ventricle with distinct morphologies.
assessment. Thus, a pressure-volume loop during a single beat in temporal domain is possibly the best way of assessing function.10 However, it is clinically impractical to obtain this information by a convenient and reproducible method. So, we look for surrogates and correlates.
• In spatial domain, fractional area change or ejection fraction or volume leftover at end-ejection are parameters of function (Figs 11.12A and B).
• In temporal domain, ejection period or filling period or a ratio of time spent during isovolumic phase to ejection phase provide functional information of clinical value.

Fig. 11.11: Transthoracic echocardiography short-axis view. Complex geometry of the right ventricular chamber; inflow on the left side, trabecular portion in the middle and the conus on right side. The right ventricular outflow tract (RVOT) becomes an important contractile chamber in diseased states.

Figs 11.12A and B: Estimation of the right ventricle function by optimizing a transthoracic echocardiography four-chamber view. Fractional area change and end-systolic volume can be estimated.
• Typically, the RV spends less time during isovolumic phase compared to the LV and hence it is more energy- efficient (Fig. 11.13). Increase in this period is the early indication of the failing RV.
• the right ventricular ejection time is about 30-50 milliseconds longer because of the outflow chamber, which contracts near the end of systole.
• the right ventricular ejection period shows phasic variation with increase during inspiration.
• Lack of phasic variation may suggest onset of dysfunction if there is no abnormal interchamber communication (Fig. 11.14).
• Indirect assessment of the right ventricular function includes integrity of inflow valve and the outflow valve. Fortuitously, there are ubiquitous tricuspid and pulmonary valve leaks, which can provide information
on preload, afterload and forward vascular resistance (Figs 11.14 and 11.15).
Slopes of tissue velocity propagation during isovo- lumic phase do correlate with intrinsic contractility (Fig. 11.16).
Geometric alterations are not an indicator of dysfunction but suggest that the latter may be present or will occur in future.
Quantum and speed of longitudinal motion of this complex chamber has also found clinical utility, because most deep fibers of the RV are longitudinally arranged. Longitudinal motion has fair correlation with ejection performance.
Patterns of flow and tissue movements also help in detecting abnormalities in pressure-volume loops and provide some meaningful information.

Fig. 11.13: Right ventricle free wall tissue velocity image. Note that isovolumic contraction (IVC) and isovolumic relaxation (IVR) periods are very brief.

Fig. 11.14: Continuous wave Doppler interrogation of the right ventricular outflow tract. Physiological pulmonary regurgitation with a peak diastolic velocity of 2 m/s is observed. Note the duration of regurgitation increasing during expiration and decreasing during inspiration. Lack of phasic variation is a sign of dysfunction.

Fig. 11.15: Physiological tricuspid regurgitation jet with a peak velocity of 2.68 m/s. Note the respiratory variation. A peak transtricuspid velocity > 3.5 m/s is suggestive of elevated right ventricular systolic pressure and velocities between 2.8 and 3.4 m/s are of borderline significance.
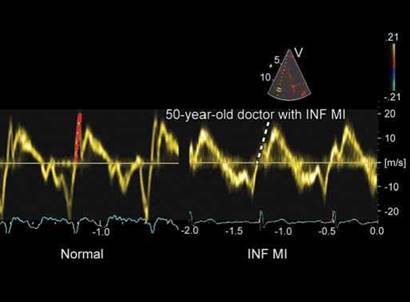
Fig. 11.16: Right ventricle (RV) free wall tissue velocity profile. Note the difference between acceleration slopes in left (normal subject) and right panel [inferior myocardial infarction (INF MI) with possible RV infarction).
RIGHT VENTRICLE DIASTOLIC FUNCTION AND PRESSURES
• Preload is an important determinant of the right ventricular function. A crude measure of the preload is right atrial pressure or right ventricular end-diastolic pressure.
• It is difficult to measure right atrial volume or the right ventricular diastolic volume by echocardiography.
• Respiratory variations in filling may be better markers of preload11 (Figs 11.14 and 11.15).
• Right atrial pressure or RV end-diastolic pressure can be measured directly during right-heart catheterization or estimated noninvasively by assessing inferior vena cava diameter and collapse index.12 Dilated (> 20 mm) and noncollapsing inferior vena cava is suggestive of mean right atrial pressure > 15 mm Hg (Fig. 11.17). A dilated inferior vena cava with inspiratory or

Fig. 11.17: Dilated inferior vena cava indicates elevated right atrial pressure. Reduced inspiratory collapse is specific. A collapse index < 50% is highly suggestive of right atrial pressure > 10 mm.

Fig. 11.18: M-mode section of the inferior vena cava with reduced inspiratory collapse.
Fig. 11.19: Transthoracic echocardiography four-chamber view at end-diastole showing bulge of the interatrial septum to the left, indicating right atrial pressure higher than left atrial pressure in diastole.

Fig. 11.20: Prominent diastolic tricuspid regurgitation indicating elevated right ventricle diastolic pressures in a patient with dilated cardiomyopathy.
sniff-related collapse of < 50% indicates elevated mean right atrial pressure (> 10 mm Hg).
• The annular tricuspid E/e ratio and annular tissue Doppler relaxation time have also shown moderate correlation with right atrial pressure.13
• Raised right atrial pressure can also be judged from movement of the interatrial septum or the hepatic vein flow spectrum14 (Figs 11.19 and 11.20). A decrease in systolic wave and a marked increased in atrial reversal wave in hepatic veins indicate raised right atrial pressure.
• Estimation of the right ventricular end-diastolic pressure from the Doppler pulmonary regurgitation
signal can be a good surrogate when jugular venous pressure is added to the pulmonary end-diastolic pressure gradient.
• Elevated right ventricular diastolic pressures can also be judged from the presence of diastolic tricuspid regurgitation, diastolic antegrade flow across the pulmonary valve or from the patterns of pulmonary regurgitation (Figs 11.20 to 11.25).
• It is also possible to estimate -dP/dt from tricuspid regurgitation signal (Fig. 11.26).
Pulsed wave Doppler tricuspid flow velocities can also be used for assessing RV diastolic function. An E/A <
0.8 indicates abnormal relaxation. A combined flow and

Fig. 11.21: Flow Doppler alternans of the tricuspid regurgitation with normal right ventricular systolic pressure. Doppler alternans is suggestive of global right ventricle dysfunction.

Fig. 11.22: Operated tetralogy of Fallot in an adult showing antegrade diastolic flow across pulmonary valve (arrows), indicating elevated right ventricular diastolic pressure.

Fig. 11.23: Rapidly decelerating pulmonary regurgitation jet with end-diastolic antegrade flow across pulmonary valve (arrows) suggestive of raised right ventricle end-diastolic pressure.

Fig. 11.24: Continuous wave Doppler interrogation of the pulmonary regurgitation jet. The pattern is classic of normal right ventricular diastolic pressure as estimated by end-diastolic gradient and mid-diastolic dip.

Fig. 11.25: Restrictive transtricuspid pulsed wave Doppler flow velocities. A deceleration time varies with respiration, from 100 to 130 milliseconds. Averaging five beats in quiet respiration is required to obtain mean values.
tissue early diastolic velocity ratio E/e' > 6 is also abnormal. A E/A ratio of > 2 with deceleration time < 120 milliseconds is suggestive of restrictive RV diastolic function.
Right Ventricular Volumetric Function
In clinical practice, the right ventricular ejection fraction (RVEF) is the most commonly used index of RV contractility. Although widely accepted, RVEF is highly dependent on loading conditions and may not adequately reflect contractility.15 Because the RV chamber is larger than the LV chamber, RVEF is, under normal conditions, lower than LV ejection fraction. the normal range of RVEF varies between 40% and 76% depending on the methodology used.16 Magnetic resonance imaging (MRI) is the most accurate method for measuring RVEF. According to Lorenz et al.4 the normal value of RVEF is 61 ± 7%, ranging

Fig. 11.26: Estimation of dP/dt from tricuspid regurgitation (make it yellow) signal. Pressure drop from 1 m/s velocity to 2 m/s is multiplied by the time taken to attain 2 m/s velocity.

Fig. 11.27: Right ventricle short-axis dimension and area in four-chamber view are the two best correlates of the volumes.
from 47% to 76%. RV images can be acquired in the short- axis or long axial direction. Alfakih et al.15 demonstrated that the axial orientation resulted. in a better intraobserver and interobserver reproducibility than the short-axis orientation. the lower limit of radionuclide-derived normal RVEF ranges from 40% to 45%.17 To be accurate, volume assessment should always take into account the complex shape of the RV. Furthermore, the infundibulum should be included in the volume measurement because it can account for as much as 25% to 30% of RV volume.18
• the simplest and most routinely used method for assessing RV volume includes linear dimensions and areas obtained from single tomographic echocar- diographic planes. the best correlations between single-plane measurements and RV volumes have been obtained with the maximal short-axis dimension and the planimetered RV area (in the four-chamber view; Fig. 11.27).
• Significant overlap has been noted, however, between normal and volume-overloaded conditions, especially for mild to moderate enlargement.18
• In an effort to be more accurate, different approaches have been sought to directly measure RV volume. ttese include the area-length method and Simpson's approach. In two-dimensional (2D) echocardiography, numerous studies showed that the area-length method that uses an ellipsoid or pyramidal model correlates better with RV volume than Simpson's rule.18 the main difficulty seen with the application of Simpson's rule to 2D echocardiographic images is obtaining two appropriate orthogonal views with a common long axis.
• ttree-dimensional (3D) echocardiography is a promising technique that could lead to more accurate assessment of RV volume.19,20 Echocardiography is less accurate than the nuclear methods. Two-dimensional assessment of RVEF with Simpson's rule and the area-length method show moderate correlation with radionuclide- or MRI-derived RVEF.18 In the clinical setting, 3D echocardiography has also shown variable correlations with RVEF,19,20 although there have been some studies that have not supported the strong relationship. Difficulties include delineation of the anterior wall and identification of the infundibular plane.
• Right ventricle fractional area change represents the ratio of systolic area change to diastolic RV area. It is measured in the four-chamber view and can be incorporated systematically into the basic echocardiographic study. A fractional area change of < 35% indicates RV systolic dysfunction. In diverse conditions, a good correlation has been reported between RV fractional area change and RVEF21 (Fig. 11.28).
Assessing Longitudinal Function
the RV contracts by three separate mechanisms:
1. Inward movement of the free wall, which produces a bellows effect
2. Contraction of the longitudinal fibers, which shortens the long axis and draws the tricuspid annulus toward the apex (Fig. 11.29)

Figs 11.28A and B: Fractional area change (44%) in a normal person estimated in four-chamber view.

Fig. 11.29: Longitudinal shortening of the right ventricle free wall (-38%), which is nearly twice that of the interventricular septum.

Fig. 11.30: Right ventricle (RV) apical circumferential strain compared to the left ventricle apical one in a normal subject. There is hardly any circumferential strain in the RV apex.

Fig. 11.31: Tricuspid annular plane systolic excursion (TAPSE) displayed in M-mode in a normal adult patient.
3. Traction on the free wall at the points of attachment to the LV. There is no twisting or rotation (Fig. 11.30). Longitudinal motion is the predominant way of ejection.22 Large surface area due to trabeculations produces effective stroke volume at low pressure.23 However, it is difficult to assess area change accurately in any view.
Tricuspid annular plane systolic excursion is another useful quantitative measurement of RV systolic performance24 (Fig. 11.31). This method reflects the longitudinal systolic excursion of the lateral tricuspid valve annulus toward the apex. It is usually measured with 2D-directed M-mode imaging in the four-chamber view. Normal values are usually > 15 mm25 (Fig. 11.31). Studies showed moderate correlation between tricuspid annular plane systolic excursion (TAPSE) and RVEF measured by radionuclide angiography.26,27 However, some studies show better correlation between RVEF by MRI and TAPSE than with real-time 3D echocardiography.27 Measurements of tricuspid annular motion are easy to obtain, correlate with RV systolic function and have a high specificity and negative predictive value for detecting abnormal RV systolic Junction25 (Fig. 11.32).
Longitudinal motion of the RV can also be assessed by studying the tricuspid annular velocities. Tissue Doppler imaging, which measures myocardial velocities, also allows quantitative assessment of RV systolic function 28,29

Fig. 11.32: Tricuspid annular plane systolic excursion (TAPSE) displayed in M-mode in an adult patient with hypoplastic right heart syndrome. Reduced TAPSE and post-systolic excursion are both indicative of systolic dysfunction.

Fig. 11.33: Tricuspid annular peak systolic velocity (TAPSV) of 12 cm/s (normal) in a 74-year-old male. TAPSV does not decrease linearly with advancing age. Reduced early diastolic velocity is indicative of diastolic dysfunction.

Fig. 11.34: TAPSV of 6 cm/s indicative of right ventricle systolic dysfunction. Markedly prolonged isovolumic relaxation time (IVRT) suggests abnormal myocardial performance index.

Fig. 11.35: Assessment of myocardial performance index (MPI) from combined right ventricle inflow and outflow Doppler spectra.
(Fig. 11.33). Systolic tissue Doppler signal of the tricuspid annulus (TAPSV) has been studied as an index of RV function in patients with heart failure (Fig. 11.34).
Various cut-off limits have been proposed. In one study, peak systolic values < 11.5 cm/s identified the presence of ventricular systolic dysfunction (RVEF
< 50%) with a sensitivity and specificity of 90% and 85%, respectively.28 A recent study has found good discriminating power when compared to real-time 3D echocardiographic ejection fraction when a threshold of
< 9.5 cm/s is used for predicting RVEF < 40%.30 A proposed
threshold value of < 10 cm/s is a good way to remember.25 ttis cut-off value predicts cardiac index < 2 L/min/m2 with a sensitivity of 89% and specificity of 87%.31
Right ventricular myocardial performance index (MPI), which is the ratio of isovolumic time intervals to ventricular ejection time, has been described as a nongeometric index of global ventricular function32 (Fig. 11.35). It can be obtained either by superimposing tricuspid inflow and the

Fig. 11.36: Isovolumic acceleration (IVA). Time velocity integral (TVI)-based right ventricle contractility index: isovolumic velocity from first sharp peak during systole at onset of QRS/time to peak velocity. In the Figure shown, this value is 12/0.025 = 4.8 m/s2. Normal values are > 1.5 m/s2.

Fig. 11.37: Markedly reduced tricuspid annular systolic and early diastolic velocities (3-4 cm/s) in a 64-year-old male patient with stable coronary artery disease. The patient needed prolonged inotropic support following coronary artery bypass grafting (CABG).
right ventricular outflow Doppler flow, provided there are no differences in heart rate. Alternately, tissue Doppler spectrum of the tricuspid annulus can be used to measure isovolumic periods and ejection time.
Right ventricular MPI appears to be relatively independent of preload, afterload and heart rate, and has been useful in assessing patients with congenital heart disease, valvular heart disease and pulmonary hypertension.33-35
the normal value of this index is 0.28 ± 0.04, and it usually increases in the presence of RV systolic or diastolic dysfunction. A threshold value of > 0.50 is a good clinical parameter.35 Its correlation with RVEF is modest, but specificity is very high.
Pseudonormalized MPI can occur in acute RV myocardial infarction, which can probably be explained by a decrease in isovolumic contraction time associated with an acute increase in RV diastolic pressure.36
Other Parameters of Right Ventricle Doppler Myocardial Imaging
Isovolumic acceleration (IVA) represents a new tissue Doppler-derived parameter of systolic performance.37 It is calculated by dividing the maximal isovolumic myocardial velocity by the time to peak velocity: IVA = maximum velocity/time to peak (Fig. 11.36).
Vogel et al.37 studied the value of myocardial IVA in a closed-chest animal model during modulation of preload, afterload, contractility and heart rate. tteir study showed
that IVA reflects RV myocardial contractile function and is less affected by preload and afterload within a physiological range than either the maximum first derivative of RV pressure development (dP/dtmax) or ventricular elastance. Clinical studies have confirmed its value in congenital heart disease, that is, after repair of tetralogy of Fallot and in transposition.38 IVA positively correlates with global longitudinal strain and strain rate (SR) and negatively with MPI.38
ttere have been a few studies on the utility of early diastolic myocardial velocities of the tricuspid annulus and the RV free wall as a marker or global or diastolic dysfunction23 (Fig. 11.37).
Strain is defined as the degree of deformation of an object, whereas SR represents the speed at which strain occurs. Ultrasound-based Strain SR/strain imaging is a practical, reproducible clinical technique, which allows the calculation of regional longitudinal and radial deformation from RV segments. Indices such as SR and strain are free of geometric assumptions and, thus, may provide new insights into right ventricular function.39 Both these indices correlate with multiple parameters of RV systolic function. In echocardiography, RV longitudinal strain can be assessed reliably from apical views, whereas radial strain is difficult and is hampered by near-field artifacts and extremely small computational distance.
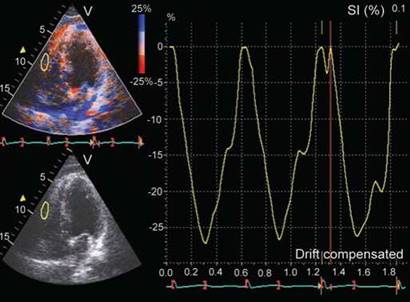
Fig. 11.38: TVI-based strain of right ventricle free wall in a normal subject. Longitudinal Doppler strain is -27% (normal > -20%).

Fig. 11.39: Two-dimensional longitudinal strain in an adult patient with hypoplastic right heart syndrome. Global systolic strain is markedly reduced (-7.7%) and there is evidence of post-systolic strain in right ventricle free wall along with paradoxical strain in the interventricular septum.
In mathematical models and in experimental studies, longitudinal strain appears to correlate best with changes in stroke volume, whereas longitudinal SR is more related to local contractile function and appears to be more independent of loading 40 (Figs 11.38 and 11.39).
Strain and SR can be estimated either by Doppler myocardial imaging or by non-Doppler 2D-strain using acoustic speckle tracking or velocity vector imaging.38,40 The latter is gaining more ground because it is angle- independent and more reproducible. In a recent study,38 good correlations were found between RVEF and free wall SR and strain.
Right ventricle, septal systolic strain and SR may allow the recognition of early RV dysfunction even when conventional RV systolic parameters are normal.41
The RV, an underestimated chamber, is affected by primary disorders of the right heart diseases, which affect both ventricles concomitantly as a result of ventricular interdependence when the LV alone is involved and secondary to back-pressure effects. Knowledge about the role of the right ventricular function in health and disease has lagged behind that of the LV. However, seminal work has been published in the past two decades. It is a thin-walled chamber with complex geometry, heavy trabeculations, three distinct parts and three distinct muscle bundles. There is now increasing information about the importance of the RV in patients with stable coronary artery disease, heart failure, acute myocardial
infarction, pulmonary hypertension, Eisenmenger syndrome, adult congenital heart disease, response to drug therapy, exercise capacity in various disorders and valvular heart disease. Right ventricular volumetry and ejection fraction estimation unlike that of the LV is a tedious, less robust and less validated parameter of the right ventricular function despite use of real-time 3D echocardiography. In clinical practice, assessment of right ventricular function is a combination of several parameters that include estimation of its size and mass, movement of tricuspid annulus plane, peak systolic velocity of the tricuspid annulus motion, global myocardial performance index, estimation of the Doppler and non- Doppler-derived strain and SR of the RV in general and its free wall in particular, and estimation of the right ventricular systolic and diastolic pressures by flow Doppler spectrum of tricuspid and pulmonary regurgitations. Global longitudinal strain of the RV by acoustic speckle tracking appears to be a very robust technique that needs further cross-sectional and longitudinal studies and its impact on prognosis in diverse disorders. Impetus to this field has been given by competing techniques like MRI and computed tomography CT.
REFERENCES
1. Lee FA. Hemodynamics of the right ventricle in normal and disease states. Cardiol Clin. 1992;10(1):59-67.
2. Goldstein J. The right ventricle: what's right and what's wrong. Coron Artery Dis. 2005;16:1-3.
3. Farb A, Burke AP, Virmani R. Anatomy and pathology of the right ventricle (including acquired tricuspid and pulmonic valve disease). Cardiol Clin. 1992;10(1):1-21.
4. Lorenz CH, Walker ES, Morgan VL, Klein SS, Graham TP Jr. Normal human right and left ventricular mass, systolic function, and gender differences by cine magnetic resonance imaging. J Cardiovasc Magn Reson. 1999;1(1):7-21.
5. Dell'Italia LJ. the right ventricle: anatomy, physiology, and clinical importance. Curr Probl Cardiol. 1991;16(10): 653-720.
6. Petitjean C, Rougon N, Cluzel P. Assessment of myocardial function: a review of quantification methods and results using tagged MRI. J Cardiovasc Magn Reson. 2005;7(2): 501-16.
7. Davidson C, Bonow R. Cardiac catheterization. In: Zipes D, Libby P, Bonow R, Braunwald E (Eds). Braunwald's Heart Disease: A Textbook of Cardiovascular Medicine, 7th edition. Philadelphia, PA: Elsevier; 2005.
8. Haupt HM, Hutchins GM, Moore GW. Right ventricular infarction: role of the moderator band artery in determining infarct size. Circulation. 1983;67(6):1268-72.
9. Brown KA, Ditchey RV. Human right ventricular end-systolic pressure-volume relation defined by maximal elastance. Circulation. 1988;78(1):81-91.
10. Brimioulle S, Wauthy P, Ewalenko P, et al. Single-beat estimation of right ventricular end-systolic pressure- volume relationship. Am J Physiol Heart Circ Physiol. 2003;284(5):H1625-30.
11. Michard F, Teboul JL. Predicting fluid responsiveness in ICU patients: a critical analysis of the evidence. Chest. 2002;121(6):2000-8.
12. Moreno FL, Hagan AD, Holmen JR, Pryor TA, Strickland RD, Castle CH. Evaluation of size and dynamics of the inferior vena cava as an index of right-sided cardiac function. Am J Cardiol. 1984;53(4):579-85.
13. Abbas A, Lester S, Moreno FC, Srivathsan K, Fortuin D, Appleton C. Noninvasive assessment of right atrial pressure using Doppler tissue imaging. J Am Soc Echocardiogr. 2004;17(11):1155-60.
14. Appleton CP, Hatle LK, Popp RL. Superior vena cava and hepatic vein Doppler echocardiography in healthy adults. J Am Coll Cardiol. 1987;10(5):1032-9.
15. Alfakih K, Plein S, Bloomer T, Jones T, Ridgway J, Sivanan- than M. Comparison of right ventricular volume measurements between axial and short axis orientation using steady-state free precession magnetic resonance imaging. J Magn Reson Imaging. 2003;18(1):25-32.
16. Jain D, Zaret BL. Assessment of right ventricular function. Role of nuclear imaging techniques. Cardiol Clin. 1992;10(1):23-39.
17. Kjaer A, Lebech AM, Hesse B, Petersen CL. Right-sided cardiac function in healthy volunteers measured by first- pass radionuclide ventriculography and gated blood-pool SPECT: comparison with cine MRI. Clin Physiol Funct Imaging. 2005;25(6):344-9.
18. Jiang L. Right ventricle. In: Weyman AE (Ed). Principle and Practice of Echocardiography. Baltimore, MD: Lippincott Williams & Wilkins;1994:901-21.
19. Tamborini G, Brusoni D, Torres Molina JE, et al. Feasibility of a new generation three-dimensional echocardiography for right ventricular volumetric and functional measurements. Am J Cardiol. 2008;102(4):499-505.
20. Lu X, Nadvoretskiy V Bu L, et al. Accuracy and reproducibility of real-time three-dimensional echocardiography for assessment of right ventricular volumes and ejection fraction in children. J Am Soc Echocardiogr. 2008;21(1):84-9.
21. Anavekar NS, Gerson D, Skali H, Kwong RY, Yucel EK, Solomon SD. Two-dimensional assessment of right ventricular function: an echocardiographic-MRI correlative study. Echocardiography. 2007;24(5):452-6.
22. Nikitin NP, Withe KK, 'frackray SD, de Silva R, Clark AL, Cle- land JG. Longitudinal ventricular function: normal values of atrioventricular annular and myocardial velocities measured with quantitative two-dimensional color Doppler tissue imaging. J Am Soc Echocardiogr. 2003;16(9):906-21.
23. Brown GF. Vascular pattern of myocardium of right ventricle of human heart. Br Heart J. 1968;30:679-86.
24. Hammarstrom E, Wranne B, Pinto FJ, Puryear J, Popp RL. Tricuspid annular motion. J Am Soc Echocardiogr. 1991;4(2):131-9.
25. Miller D, Farah MG, Liner A, Fox K, Schluchter M, Hoit BD. The relation between quantitative right ventricular ejection fraction and indices of tricuspid annular motion and myocardial performance. J Am Soc Echocardiogr. 2004;17(5):443-7.
26. Ueti OM, Camargo EE, Ueti AA, de Lima-Filho EC, Nogueira EA. Assessment of right ventricular function with Doppler echocardiographic indices derived from tricuspid annular motion: comparison with radionuclide angiography. Heart. 2002;88:244-8.
27. Kjaergaard J, Petersen CL, Kjaer A, Schaadt BK, Oh JK, Has- sager C. Evaluation of right ventricular volume and function by 2D and 3D echocardiography compared to MRI. Eur J Echocardiogr. 2006;7(6):430-8.
28. Meluzin J, Spinarova L, Bakala J, et al. Pulsed Doppler tissue imaging of the velocity of tricuspid annular systolic motion; a new, rapid, and non-invasive method of evaluating right ventricular systolic function. Eur Heart J. 2001;22(4):340-8.
29. Saxena N, Rajagopalan N, Edelman K, Lopez-Candales A. Tricuspid annular systolic velocity: a useful measurement in determining right ventricular systolic function regardless of pulmonary artery pressures. Echocardiography. 2006;23(9):750-5.
30. De Castro S, Cavarretta E, Milan A, et al. Usefulness of tricuspid annular velocity in identifying global RV dysfunction in patients with primary pulmonary hypertension: a comparison with 3D echo-derived right ventricular ejection fraction. Echocardiography. 2008;25(3):289-93.
31. Rajagopalan N, Saxena N, Simon MA, Edelman K, Mathier MA, Lopez-Candales A. Correlation of tricuspid annular velocities with invasive hemodynamics in pulmonary hypertension. Congest Heart Fail. 2007;13(4):200-4.
32. Tei C, Dujardin KS, Hodge DO, Bailey KR, McGoon MD, Tajik AJ, et al. Doppler echocardiographic index for assessment of global right ventricular function. J Am Soc Echocardiogr. 1996;9:838-47.
33. Eidem BW, Tei C, O'Leary PW, Cetta F, Seward JB. Nongeometric quantitative assessment of right and left ventricular function: myocardial performance index in normal children and patients with Ebstein anomaly. J Am Soc Echocardiogr. 1998;11(9):849-56.
34. Yeo TC, Dujardin KS, Tei C, Mahoney DW, McGoon MD, Seward JB. Value of a Doppler-derived index combining systolic and diastolic time intervals in predicting outcome in primary pulmonary hypertension. Am J Cardiol. 1998;81(9):1157-61.
35. Mohan JC, Sengupta PP, Arora R. Immediate and delayed effects of successful percutaneous transvenous mitral commissurotomy on global right ventricular function in patients with isolated mitral stenosis. Int J Cardiol. 1999;68(2):217-23.
36. Yoshifuku S, Otsuji Y, Takasaki K, Yuge K, Kisanuki A, Toyo- naga K, et al. Pseudonormalized Doppler total ejection isovolume (Tei) index in patients with right ventricular acute myocardial infarction. Am J Cardiol. 2003;91:527-31.
37. Vogel M, Schmidt MR, Kristiansen SB, et al. Validation of myocardial acceleration during isovolumic contraction as
a novel noninvasive index of right ventricular contractility: comparison with ventricular pressure-volume relations in an animal model. Circulation. 2002;105(14):1693-9.
38. Chow PC, Liang XC, Cheung EW, Lam WW, Cheung YF. New two-dimensional global longitudinal strain and strain rate imaging for assessment of systemic right ventricular function. Heart. 2008;94(7):855-9.
39. Kowalski M, Kukulski T, Jamal F, et al. Can natural strain and strain rate quantify regional myocardial deformation? A study in healthy subjects. Ultrasound Med Biol. 2001;27(8):1087-97.
40. Jamal F, Bergerot C, Argaud L, Loufouat J, Ovize M. Longitudinal strain quantitates regional right ventricular contractile function. Am J Physiol Heart Circ Physiol. 2003;285(6):H2842-7.
41. Kittipovanonth M, Bellavia D, Chandrasekaran K, Villar- raga HR, Abraham TP, Pellikka PA. Doppler myocardial imaging for early detection of right ventricular dysfunction in patients with pulmonary hypertension. J Am Soc Echocardiogr. 2008;21(9):1035-41.