
INTRODUCTION
Both ventricles of the heart are bidirectional hemodynamic pumps and engage in functions of suction (relaxation) and ejection (contraction). Relaxation aids in filling during diastole, and therefore, filling parameters denote diastolic function. The phenomena of relaxation and contraction are interlinked and energy-dependent. Diastole precedes systole, because no ejection is possible unless there is filling first. The processes of relaxation and filling constitute diastolic function. Increased resistance to filling is the simplest way of defining diastolic dysfunction. Diastolic dysfunction is the first manifestation of a disease process and explains the symptoms better. Abnormalities of diastolic function are common to virtually all forms of cardiac disease. Noninvasive evaluation of diastolic ventricular function is based on Doppler echocardiographic visualization of inflow and/or ventricular tissue re-extension, although many more parameters are described.
The study of pressure-volume loop during diastole is the ideal way to understand and assess diastolic function. However, there are several surrogate methods and parameters in echo-Doppler techniques, which provide reasonable, reliable and actionable information about diastolic function. In general, diastolic dysfunction may be characterized by enlargement of upstream chamber (atrium), alteration in various phases of diastole and raised filling pressures. However, diastolic dysfunction is dynamic and in early phases, filling pressures are
not increased. Assessment of diastolic function in simulated physiological situation, like exercise, may provide enhanced information. Diastolic compensatory mechanisms that maintain filling volume are the earliest evidence of dysfunction. There is also evidence of regional diastolic wall motion nonuniformity. Nonin vasive surrogates often reported in clinical studies reflect integrative properties that lack specificity.
PHYSIOLOGY OF DIASTOLE
Diastolic dysfunction is the physiological expression of morphological cardiovascular disease. The healthy myocardium is an active, nonlinear, nonhomogeneous and anisotropic viscoelastic material. During diastolic lengthening, normal cardiac muscle behaves like a spring. When the spring is more forcefully compressed during systole, diastolic lengthening is higher and vice versa (Fig. 12.1).
There is a certain degree of systolic elastance and also a definite degree of diastolic elastance.1 In several disease states like hypertension, diabetes and left ventricular hypertrophy as also with aging, systolic elastance remains unaffected or may actually increase, and diastolic elastance decreases, which can be studied and assessed by echo-Doppler parameters of diastolic function (Fig. 12.2).
On the other hand, when systolic elastance is reduced, diastolic elastance initially increases due to remodeling and diastolic dysfunction denoted by filling pressures, therein, is a manifestation of fluid overload. Most systemic

Fig. 12.1: Left ventricular pressure-volume loop. Note that the diastole is a mirror image of systole.
(IVR: Isovolumic relaxation; IVC: Isovolumic contraction; RF: Rapid filling; AS: Atrial systole).

Fig. 12.2: Pressure-volume loop of a normal subject (green color) and that of a subject with diastolic dysfunction (red color). Note the same end-systolic elastance but with reduced end-diastolic elastance.

Fig. 12.3: Diastolic dysfunction in clinical sense is raised diastolic pressures, which means reduced compliance or increased diastolic stiffness.
diseases affect the left ventricle (LV) primarily, and therefore, it is pertinent to discuss largely about the left ventricular diastolic function/dysfunction.
FACTORS CONTRIBUTING TO DIASTOLE
• Decline of the myocardial active state following systole
• Passive effects of connective tissue
• Rapid changes in atrial and ventricular pressures
• Transmitral flow
• Interactions with the right ventricle and pericardium
• Atrial systole
SIGNIFICANCE OF DIASTOLIC FUNCTION
• Identification of preclinical diseases in probands
• Diagnosis of clinical syndrome of heart failure
• Marker of incremental prognosis in diverse cardiac disorders
• Monitoring therapy and follow-up
• Understanding exercise physiology
• Cardiac versus noncardiac dyspnea
• Physiological versus pathological remodeling
• Optimizing devices and drugs response
• Evaluation of intraventricular dyssynchrony
• Study of pericardial diseases
ttere is no single definition for diastolic dysfunction; many features can get altered, and any one change or their combination is typically called diastolic dysfunction, although the pathophysiology and functional significance varies greatly.2-4 Clinically, the most common manifestation is an elevated end-diastolic pressure and altered filling patterns, but neither of these identifies specific features of diastolic dysfunction (Fig. 12.3).
When diastolic dysfunction is detected, it has some morphological, cellular and proteomic connotations. ttese are:
• A change in the extracellular matrix of the myocardium, with the formation of excess collagen tissue5
• At the cellular level, there is reduced phosphorylation of sarcomeric proteins
• At the proteomic level, an isoform change in important structural macromolecular proteins such as titin.6
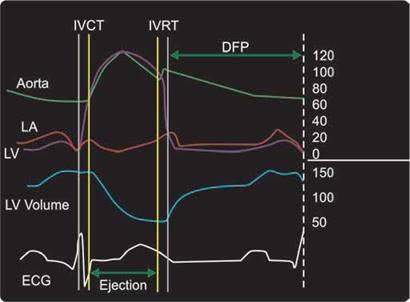
Fig. 12.4: Graphical representation of various phases of the cardiac cycle of the left heart.
(DFP: Diastolic filling period).

Fig. 12.5: Continuous wave Doppler interrogation with sample volume placed between the left ventricular outflow and the inflow showing all four phases of diastole.
(IVR: Isovolumic relaxation; RF: Rapid filling; diastasis—slow filling and AC—late filling due to atrial contribution).

Fig. 12.6: Doppler signal from left ventricular inflow close to outflow tract showing all phases of cardiac cycle.
(ET: Ejection time; IVC: Isovolumic contraction).
Diastole starts with closure of the aortic valve and ends with onset of ventricular contraction (Fig. 12.4). It has an initial period of ventricular relaxation without filling (isovolumic relaxation time [IVRT]) and then three phases of ventricular filling (DFP). the four phases of diastole are:7
1. Isovolumic relaxation phase
2. Rapid filling phase
3. Diastasis
4. Late diastolic filling due to atrial contraction.
Diastolic LV function can be assessed in each of the four
phases of diastole—isovolumic relaxation, rapid filling, slow filling and atrial contraction (Fig. 12.5). ttese four phases uniquely reflect cardiomyocyte, myocardial or LV
physiology, and are invariably accessible to noninvasive evaluation. Diastolic dysfunction is an abnormality that causes impaired relaxation (and decreased ventricular suction), poor filling or loss of atrial contraction.7
ttere are two phases in systole (Fig. 12.6). ttese are:
1. Isovolumic contraction phase (IVC)
2. Ejection phase.
Combined systolic and diastolic function can be assessed by the ratio of IVRT + IVC time/ejection time. ttis ratio has been called myocardial performance index.8 Although used for prognosis in various diseased states, it has not found practical utility for daily use in most echocardiography labs.
Isovolumic relaxation time, which corresponds to the time interval from aortic valve closure to mitral valve opening, is difficult to appreciate from simultaneous LV pressure, aortic pressure and wedge pressure recordings but is easily measured by continuous wave Doppler from the simultaneous display of the end of aortic ejection and the onset of mitral inflow (Fig. 12.7).
IVRT has a predictable quantitative relationship to constant of isovolumic relaxation and to left atrial (LA) and aortic pressures.8
• Prolonged IVRT indicates poor myocardial relaxation.
• A normal IVRT is about 70 ± 12 milliseconds, and approximately 10 milliseconds longer in people above 40 years of age.

Fig. 12.7: Doppler interrogation between left ventricle outflow and inflow showing measurement of isovolumic relaxation time (IVRT). At heart rate of 66 beats/min, IVRT is 76 milliseconds in this normal subject.

Fig. 12.8: Variables affecting rapid filling phase in diastole. (PR: P wave to ORS wave interval).
• In abnormal relaxation, IVRT is usually in excess of 110 milliseconds.
• With restrictive filling, it is usually under 60 milliseconds.
• If IVRT is prolonged (> 110 milliseconds), LA pressure is not elevated because the delay in mitral valve opening is related to lower pressure crossover between LV and LA in the setting of delayed relaxation.
• It is safe to conclude that LA pressure is elevated if the IVRT is short (< 60 milliseconds) in the presence of cardiac disease.
Its clinical value as an index of diastolic LV function is limited, because it depends on mitral valve opening pressures and, therefore, is not uniquely related to LV dysfunction.
rapid filling phase
In early diastole, chamber wall relaxation unmasks stored elastic strain, allowing the LV to recoil and act as a suction pump by aspirating blood into the ventricle. Normal left ventricular (LV) filling occurs rapidly early in diastole caused by a progressive pressure gradient within the ventricle and with a low LA pressure.
Rapid filling phase accounts for 70% of left ventricular filling. It gets shorter in duration with raised filling pressures and is prolonged in subjects with impaired relaxation alone.9 When both impaired relaxation and raised LA pressure coexist, it has variable duration like in
normal subjects. Rapid filling phase is denoted by early diastolic (E) mitral flow wave and antegrade diastolic (D) flow wave of the pulmonary veins. Variables affecting rapid filling phase are shown in Figure 12.8.
DECELERATION TIME OF EARLY FILLING WAVE (MITRAL E- AND PuLMONARY D-WAVES)
Deceleration time (DT) is the duration between the peak of early filling wave and where its linear descending slope reaches zero (Fig. 12.9). Nonlinear slopes are not measured. Conditions associated with increased LV stiffness are associated with a more rapid rate of deceleration of early filling and a shorter time for this deceleration.10
• It is an index of resistance to early filling with normal values in range of 150-250 milliseconds.
• DT denotes chamber stiffness regardless of heart rate, afterload and contractility.
• DT of < 150 milliseconds indicates restrictive filling and relatively noncompliant LV (Fig. 12.10).
• DT > 250 milliseconds indicates compensatory mechanism is in place to overcome impaired relaxation. Prolonging of DT during therapy is a positive sign of recovery.
• There is a close inverse relationship between DT and pulmonary wedge pressure.
• DT is affected by age as well as pericardial restraint. As myocardial relaxation becomes less active with
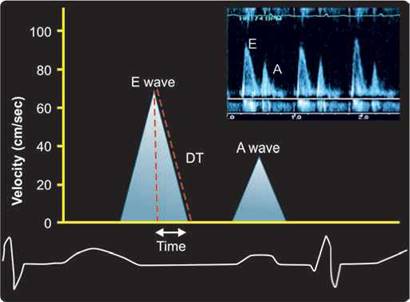
Fig. 12.9: Graphical display of deceleration time (DT) of mitral early filling wave.
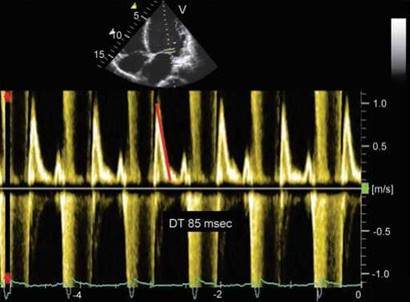
Fig. 12.10: Restrictive filling pattern with deceleration time of 85 milliseconds in a patient with dilated cardiomyopathy.
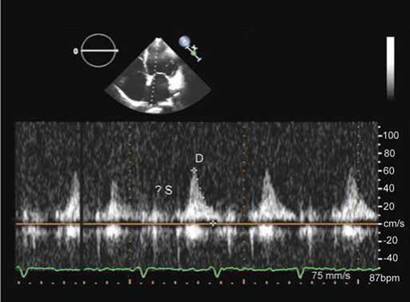
Fig. 12.11: Right upper pulmonary vein flow in a patient with atrial fibrillation. Measuring deceleration time of D-wave.

Fig. 12.12: Pulsed wave Doppler mitral flow showing positive wave (L-wave) during diastasis.
aging or abnormally delayed due to a disease process, the rate of LV pressure decline during the early diastole is reduced, and it takes a longer time to reach the minimal LV diastolic pressure.
• Longer DT indicates impaired diastolic reserve. In this situation with abnormal myocardial relaxation, a reduced diastolic filling period and a lack of atrial contraction compromise LV filling.
During the time of early flow deceleration, there is rapid flow into the LA from the pulmonary veins. DT of pulmonary vein diastolic wave has same significance as that of mitral DT (Fig. 12.11). A pulmonary vein DT of < 150 milliseconds has much greater specificity for predicting elevated filling pressures.11
During the slow LV filling phase or diastasis, residual effects of LV relaxation and 'dynamic' effects of fast LV inflow have dissipated. This phase is used to construct diastolic LV pressure-volume relations from a single cardiac cycle and allows LV stiffness, the slope of the diastolic LV pressure-volume relation, to be derived under so-called static conditions. In subjects with impaired relaxation and longer cardiac cycle, residual effects of LV relaxation may persist and positive filling wave during diastasis (L-wave) may be observed (Fig. 12.12). Mitral valve L-waves may be evident in healthy patients with relatively low heart rates.12

Fig. 12.13: Mid-diastolic negative L-wave in a patient with left ventricular diastolic dysfunction.

Fig. 12.14: Monophasic mitral flow with normal PR interval and heart rate of 69 beats/min in a 90-year-old subject.

Fig. 12.15: Graphical display of longitudinal and radial expansion of the left ventricle during diastole (arrows).
Importance of L-Wave
• the L-wave may be seen in relatively bradycardic patients with normal hearts. It is usually < 20 cm/s in velocity.
• A pathological L-wave typically is found in patients with delayed active relaxation with increased LV stiffness.
• In the echo laboratory, patients will often have clinical heart failure, left ventricular hypertrophy with normal systolic function or LV systolic dysfunction.
• A pathological L-wave is suggestive of elevated LV preload (pseudonormalization).
• A pathological L-wave has prognostic value, in that it is predictive of future hospitalizations with heart failure.
Occasionally, there can be negative L-wave or mid-diastolic mitral regurgitation due to rapid rise in LV diastolic pressure as a consequence of early filling (Fig. 12.13). Its exact significance is not clear.
ATRIAL KICK OR CONTRIBuTION
Late diastolic filling wave is of short duration and occurs due to atrial contraction just before systole starts. ttis accounts for 20-40% of ventricular filling and is absent in atrial fibrillation. ttis gets partly or completely obliterated in first degree heart block and markedly raised ventricular stiffness. Atrial kick is reflected by late diastolic (A) mitral flow wave and atrial flow reversal (Ar) in pulmonary veins. In markedly elevated left ventricular diastolic pressure, atrial contraction may not produce any antegrade flow wave and may be seen to send flow retrogradely in pulmonary veins (Fig. 12.14).
tissue motion and DIASTOLIC FuNCTION
As transmitral flow commences in diastole, the mitral annulus moves longitudinally upward toward the atrium. Due to tissue and blood incompressibility, as the annulus rises, the wall thins, and the endocardium is simultaneously displaced radially outward toward the epicardium. During filling, the short and long axes change simultaneously (Fig. 12.15). tterefore, rate of longitudinal displacement and radial endocardial displacement are good indicators of diastolic function.13 Early diastolic longitudinal excursion rate can be easily obtained from tissue Doppler studies (Fig. 12.16).

Fig. 12.16: Biphasic longitudinal expansion of the left ventricle during diastole. E', early diastolic and A', late diastolic longitudinal tissue velocity waves.

Fig. 12.17: Tissue L'-wave in diastasis (arrow).

Fig. 12.18: Estimation of biplane end-systolic left atrial volume by area-length method.
The LV wall motion generates the atrioventricular pressure gradient resulting in the early transmitral flow (Doppler E-wave) and associated vortex formation.
Substantial residual LV relaxation pressures in mid-diastole present in some patients with stiff LV can result in a positive wave called tissue L'-wave14 (Fig. 12.17).
LEFT ATRIAL VOLuME AND DIASTOLIC function/dysfunction
The measurement of maximum LA volume is an essential component of the comprehensive assessment of LV diastolic function.15,16 More recently, LA volumes have been obtained by 3D echocardiography.
The LA volume is usually measured by biplane area-length method (Fig. 12.18). In current guidelines, assessment of diastolic function mandates measurement of LA volume index in every subject. Although it has limited role in assessing diastolic function or dysfunction in acute situations, it has great relevance in chronic stable cardiovascular conditions.
• The LA volume can be viewed as a morphological expression of LV diastolic dysfunction.
• Left atrial volume is regarded as a 'barometer' of the chronicity of diastolic dysfunction.
• This simple measure of LA volume provides significant insight into an individual's risk for the development of adverse cardiovascular events, including myocardial infarction, stroke, atrial fibrillation and heart failure.
• Normal values for LA volume are 22 ± 6 mL/M2.
• Left atrial volume is graded relative to risk, 28-33 mL/ M2 = mild; 34-39 mL/M2 = moderate; and > 40 mL/M2 = high or severe.

• Diastolic dysfunction is more likely if the LA volume index exceeds 34 mL/M2.
• However, LA volume can increase in mitral regurgitation, athletes and in the presence of sinus bradycardia without concomitant diastolic dysfunction.

Fig. 12.19: Left atrial (LA) longitudinal lengthening in a normal subject compared to that of the left ventricle shortening. Typically, LA lengthening is twice or more than that of the LV shortening.

Fig. 12.20: Significantly reduced left atrial global strain in the presence of diastolic dysfunction.

Fig. 12.21: Sites for assessing diastolic function in an apical four- chamber view.
• There is a fairly good positive correlation between LA volume index and grade of diastolic dysfunction.
• Maximum LA systolic lengthening and its rate have also been found to correlate with diastolic dysfunction (Figs 12.19 and 12.20).
• It is possible to use LA strain during ventricular systole along with LA pressure or its Doppler echocardiographic surrogate (E/e') to calculate LA chamber stiffness.17
• LA stiffness has good accuracy in identifying patients in diastolic heart failure.
• Change in volume-pressure relationships in left atrium also indicates change in material properties (ischemia,
fibrosis, etc.) and physiological or pathological remodeling in the LV.
Factors extrinsic to the left ventricular myocardium may influence the end-diastolic pressure-volume relationship. Changes in intrathoracic pressure (as with spontaneous or assisted ventilation), pericardial constraints and interventricular interactions may each influence ventricular diastolic pressure (when referenced to atmospheric pressure), which therefore influences this relationship. In the absence of these, intrinsic diastolic function governs this relationship. Various equations have been derived from mitral flow and tissue expansion rate to predict end-diastolic pressure. E/e' ratio has the strongest relation to pulmonary capillary wedge pressure (PCWP) [r = 0.86, PCWP = 1.55 + 1.47(E/Ea)], irrespective of the pattern and ejection fraction.18
HOW TO PERFORM A STuDY FOCuSING ON DIASTOLIC FuNCTION
• After estimation of biplane LA volume, one proceeds to interrogate by pulsed wave (PW) Doppler, four different sites as shown in Figure 12.21.
• With the patient supine, apical four-chamber views using a 2.5-MHz transducer are obtained with the sample volume gated at 1.5-5 mm directed between the tips of the mitral valve leaflets and orthogonal to the mitral valve plane.
• Continuous wave Doppler is used to record aortic outflow and mitral inflow from the apical view for determination of the IVRT using a sweep speed of 100 mm/s.

Fig. 12.22: Biphasic mitral flow with sample volume at the tips of the mitral leaflets.

Fig. 12.23: Grade I diastolic dysfunction in transmitral flow with prolonged deceleration time.
• In apical four-chamber view, ostium of the right upper pulmonary vein is interrogated by PW Doppler.
• M-mode of the color flow propagation velocity across the mitral valve up to 4 cm into the cavity is obtained.
• Doppler tissue imaging (DTI) of the medial and the lateral mitral annulus and M-mode images are also recorded. DTI is performed at a sample size gated at 2.5 mm.
• Effect of Valsalva maneuver is also observed for the mitral and pulmonary vein flow.
• Sometimes, supine exercise is used to study diastolic function parameters. Post exercise E/A ratio as an independent determinant of severity of exercise induced dyspnea and impaired exercise tolerance.
• Longitudinal strain and untwisting rate of the LV are also recorded by acoustic speckle tracking.
• After obtaining all the measurements, the diastolic dysfunction, if present, is graded and occasionally it may be noted as indeterminate if multiparameters give conflicting results.
The mitral inflow velocity profile is initially used to
characterize LV filling dynamics (Fig. 12.22).
• E velocity (E) represents the early mitral inflow velocity and is influenced by the relative pressures between the LA and LV, which, in turn, are dependent on multiple variables including LA pressure, LV compliance and the rate of LV relaxation.19
• A velocity (A) represents the atrial contractile component of mitral filling and is primarily influenced by LV compliance and LA contractility.
• the DT of the E velocity is the interval from peak E to a point of intersection of the deceleration of flow with the baseline and it correlates with time of pressure equalization between the LA and LV. Incomplete or delayed relaxation causes a delay in the transfer of blood from atria to ventricle.
• As the early LA and LV filling pressures either evolve toward or away from equivalence, so will the DT either shorten or lengthen, respectively.
• Diastolic dysfunction is directly related to the reduction in early LV relaxation compromising the effective transfer of the blood from the atrial reservoir into the LV cavity.
• Diastolic dysfunction can be categorized into three stages based upon transmitral filling patterns.2-4 Grade I: Impaired relaxation denoted by DT > 250
milliseconds and E/A velocity ratio < 0.8 (Figs 12.23 and 12.24). the American Society of Echocardiography(ASE) and European Association of Echocardiography (EAE) guidelines suggest DT > 200 milliseconds in Grade I.
Early in the evolution of 'diastolic dysfunction', the delay in emptying (DT > 250 milliseconds) is partially compensated by a more vigorous end-diastolic atria contraction, and, therefore, the E/A ratio is reduced (< 0.8).
Grade II: Pseudonormal pattern with DT of 150-250 milliseconds and E/A ratio between 0.8 and 1.5. ASE-EAE guidelines put DT in range of 160-200 milliseconds.
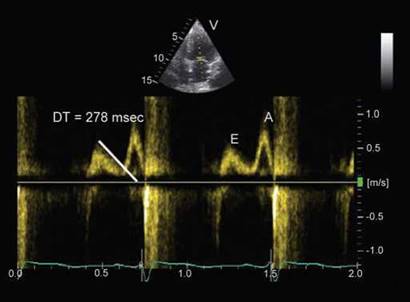
Fig. 12.24: Grade I diastolic dysfunction denoted by deceleration time of 278 milliseconds and E/A 0.7.

Fig. 12.25: Pseudonormal or Grade II diastolic dysfunction denoted by presence of L-wave (arrow).
Pseudonormal pattern needs confirmation by increased LA volume (> 34 mL/M2) or mitral E-wave velocity/annular tissue early diastolic velocity > 15 (medial) or > 12 (lateral) or pulmonary vein flow increased duration of atrial flow reversal wave or Valsalva maneuver to unearth impaired relaxation in mitral flow.
Presence of L-wave or DT < 150 milliseconds could also provide clue to pseudonormal pattern if E/A velocity ratio is 0.8-1.5.
Grade III: Restrictive flow or reduced compliance pattern with DT < 160 milliseconds and E/A ratio > 2.0. Others have used DT cut-off limits of < 150 milliseconds and < 130 milliseconds as well.
Following measurements should be made in each examination:
• Peak early filling (E-wave)
• Late diastolic filling (A-wave) velocities
• E/A ratio
• DT of early filling velocity
• IVRT
• Mitral A-wave duration (obtained at the level of the mitral annulus)
• Diastolic filling time
• A-wave velocity-time integral
• Total mitral inflow velocity-time integral (and thus the atrial filling fraction) with the sample volume at the level of the mitral annulus
• Mid-diastolic flow is an important signal to recognize. Low velocities can occur in normal subjects, but when increased (> 20 cm/s), they often represent markedly delayed LV relaxation and elevated filling pressures. Most confusions arise in so-called pseudonormal
pattern, wherein one or the other parameter can be discordant (Fig. 12.25). Help can be obtained from using multiple parameters and any of the other abnormality could be construed as abnormal diastolic function especially if the early diastolic annular tissue velocity is significantly reduced.3,4
Restrictive flow is relatively easy to detect and is unambiguous in adult patients with heart disease (Fig. 12.26).20 These criteria can not be used in children and young adults who normally have large E-waves and short DT due to very active suction of the LV.
Although not supported by the ASE, others have used Grade IV diastolic dysfunction as the one in which either the restrictive pattern is irreversible21 or has monophasic flow pattern with absent A-wave despite sinus rhythm, normal PR interval and usual heart rates (Fig. 12.27).
Mitral Inflow: Acquisition and Feasibility
• PW Doppler is performed in the apical four-chamber view to obtain mitral inflow velocities to assess LV filling.
• Color flow imaging can be helpful for optimal alignment of the Doppler beam, particularly when the LV is dilated.
• Performing continuous wave Doppler to assess peak E
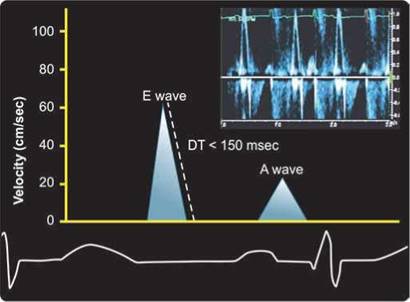
Fig. 12.26: Restrictive (Grade III) flow pattern with short deceleration time and E/A ratio > 2.

Fig. 12.27: Monophasic transmitral flow pattern in a patient with advanced diastolic dysfunction and heart failure due to previous anterior wall myocardial infarction.

Fig. 12.28: Valsalva maneuver changing restrictive flow pattern (left panel) to pattern of impaired relaxation (right panel).
(early diastolic) and A (late diastolic) velocities should be performed before applying the PW technique to ensure that maximal velocities are obtained.
• A 1- to 3-mm sample volume is then placed between the mitral leaflet tips during diastole to record a crisp velocity profile.
• Optimizing spectral gain and wall filter settings is important to clearly display the onset and cessation of LV inflow.
• Spectral mitral velocity recordings should be initially obtained at sweep speeds of 25-50 mm/s for the
evaluation of respiratory variation of flow velocities, as seen in patients with pulmonary or pericardial disease.
• If variation is not present, the sweep speed is increased to 100 mm/s, at end-expiration, and averaged over three consecutive cardiac cycles.
• the Valsalva maneuver is performed by forceful expiration (approximately 40 mm Hg) against a closed nose and mouth, producing a complex hemodynamic process involving four phases. It helps to identify pseudonormal mitral inflow and irreversible restrictive flow. A decrease in E/A ratio > 0.5 is the criterion (Figs 12.28 and 12.29).
In cardiac patients, a decrease of > 50% in the E/A ratio during Valsalva maneuver is highly specific for increased LV filling pressures, but a smaller magnitude of change does not always indicate normal diastolic function. No change in restrictive flow is an ominous sign.21
Diastolic tissue velocities measured at the mitral annulus show low-velocity deflections during early filling (e') and with atrial contraction (a') with great clarity.22,23 ttese indicate biphasic longitudinal expansion rate of the LV (Fig. 12.30).
• e' is presumed to correlate closely with LV relaxation indexes and to be relatively preload insensitive.
• Similar to mitral E flow, e' appears to be age-dependent.

Fig. 12.29: Effect of Valsalva. Upper panel shows restrictive flow pattern, which changes to pseudonormal pattern with an L-wave at the end of Valsalva maneuver.

Fig. 12.30: Annular tissue velocities from lateral edge of the mitral annulus. See text for description.

Fig. 12.31: Upper panel shows mitral inflow pattern and the lower panel depicts annular velocities from the lateral edge of the mitral annulus. An E/e' of 7 indicates normal diastolic function as the e' is 10 cm/s.
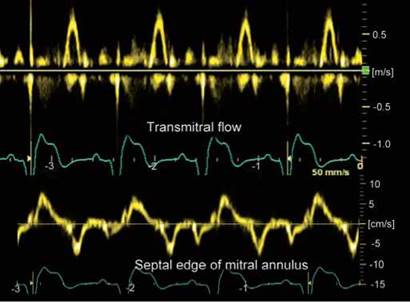
Fig. 12.32: Upper panel shows restrictive transmitral flow and the lower panel shows annular velocities of septal edge of the mitral annulus. An E/e' ratio of 10 falls in indeterminate zone.
• E depends on LA pressure, residual LV relaxation pressure and age and because e' is presumed to depend only on LV relaxation pressure, dividing E by e' eliminates LV relaxation pressure and age, so the E/e' ratio becomes a noninvasive estimate of LA pressure (Fig. 12.31).
• Septal and lateral mitral annular e' velocities differ. Recent guidelines for the detection of diastolic dysfunction recommend use of an E/e' value that is the average of septal and lateral mitral annular e'.
• A value of medial E/e' > 15 is usually proposed as evidence for elevated LV filling pressure and a value of E/e' < 8 as evidence for normal LV filling pressure.
• ttere is a wide range of E/e' values9-12 for which additional investigations are required to obtain a LV filling pressure estimate (Fig. 12.32).
• Technical limitations include angle dependency, signal noise, signal drifting, spatial resolution, sample volume and tethering artifacts.

Fig. 12.33: Lateral edge mitral annular velocities showing l' (arrow). Diastolic dysfunction is also suggested by e' < a'.

Fig. 12.34: Upper panel shows mitral E of 130 cm/s and the lower panel shows septal edge e' of 7 cm/s. E/e' ratio is 19, indicating Grade II diastolic dysfunction.
• e' can be decreased erroneously by mitral annular calcification, surgical rings or prosthetic valves.
• An average of septal and lateral E/e' > 13 is suggestive of elevated filling pressures.
• A reduced s' velocity is an indirect index of diastolic dysfunction, because there is a close correlation between longitudinal systolic function and early diastolic function.
• In healthy young individuals, septal e' is > 10 cm/s and lateral e' > 15 cm/s at rest. But there are vendor- dependent variations.
• e' < 5 cm/s in cardiac disease is reflection of advanced diastolic dysfunction.
• E/e' may not work well in patients with severe mitral regurgitation, intraventricular conduction delay, or pacemaker.
tissue velocities
• PW Doppler tissue imaging is performed in the apical views to acquire mitral annular velocities.
• The sample volume should be positioned at or 1 cm within the septal and lateral insertion sites of the mitral leaflets.
• It is recommended that spectral recordings be obtained at a sweep speed of 50-100 mm/s at end-expiration and that measurements should reflect the average of three or more consecutive cardiac cycles.
• Primary measurements include the systolic (s), early (e) and late (a) diastolic velocities.
• For the assessment of global LV diastolic function, it is recommended to acquire and measure tissue Doppler signals at least at the septal and lateral sides of the mitral annulus and their average.
• In patients with cardiac disease, e can be used to correct for the effect of LV relaxation on mitral E velocity, and the E/e ratio can be applied for the prediction of LV filling pressures.
• The E/e ratio is not accurate as an index of filling pressures in normal subjects or in patients with heavy annular calcification, mitral valve disease and constrictive pericarditis.
• Presence of tissue Doppler wave during diastasis (l') is suggestive of diastolic dysfunction (Fig. 12.33).
• Higher accuracy of a single-cycle E/e' ratio in predicting mean wedge pressure in patients with atrial fibrillation using a dual Doppler echocardiographic probe has been shown.
• Strain rate during IVRT has good correlations with the time constant of LV relaxation and -dP/dt and is not affected by changes in preload. Strain rate can be obtained by tissue velocity imaging.24
• In the presence of normal or pseudonormal mitral flow pattern, an E/e' ratio > 15 obtained from either edge of the mitral annulus suggests Grade II diastolic dysfunction (Fig. 12.34).
• In long-standing disease, an E/e' ratio may not accurately reflect the magnitude of filling pressures but may be indicative of stiff LV (Fig. 12.35).

Fig. 12.35: Upper panel shows transmitral flow, while the lower panel shows annular velocities at the septal edge in a patient on maintenance hemodialysis. An E/e' ratio of 34 does not necessarily imply very high filling pressures in this otherwise stable patient.

Fig. 12.36: Left panel shows normal transmitral flow, while mitral annular velocity at septal margin is 5 cm/s and E/e' ratio of 20 is indicative of elevated filling pressures and most likely cause of dyspnea.

Fig. 12.37: Same patient as in Figure 12.36. E/e' at lateral margin of the mitral annulus (16.5) is lower than that at the septal margin but is still way above normal. A lateral E/e' > 12 is indicative of diastolic dysfunction.

Fig. 12.38: An indeterminate E/e' ratio from the septal edge is complimented by absolute e' of 5 cm/s and e'/a ratio < 1 in suggesting diastolic dysfunction.
• Greater utility of E/e' lies in patients with systolic dysfunction as compared to those with pure diastolic dysfunction.
• In relatively younger patients, this ratio has greater predictive value for filling pressure and symptoms (Figs 12.36 and 12.37).
• If E/e' does not clearly indicate presence of diastolic dysfunction, an e'/a' ratio < 1 can be used along with other data (Fig. 12.38).
• In elderly people, all normal-appearing mitral flow patterns can not be regarded as pseudonormal. An E/e' may help define the degree of normalcy (Fig. 12.39).
• Fusion of mitral E- and A-waves may make E/e' calculation difficult (Fig. 12.40). Fusion occurs in several conditions listed below.
- Sinus tachycardia
- Prolonged PR interval
- Intraventricular dyssynchrony
- Advanced diastolic dysfunction
• In many disease states, post-systolic tissue waves may mask tissue e,' making it difficult to estimate E/e' ratio (Fig. 12.41).
• Annular post-systolic positive waves may convert severe diastolic dysfunction to mild by virtue of changing transmitral flow pattern (Fig. 12.42).
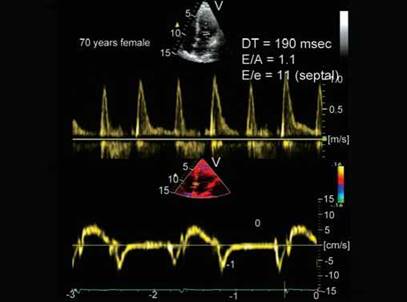
Fig. 12.39: A 70-year-old healthy woman with normal mitral flow and a septal edge E/e' of 11.

Fig. 12.40: Improbability of estimating E/e' ratio due to fusion of mitral E and A in presence of sinus tachycardia and absence of annular e'-wave (upper panel).

Fig. 12.41: Post-systolic annular tissue wave masking e'. This could be called reversed e'.

Fig. 12.42: Impaired relaxation pattern of mitral flow (upper panel) in a patient with advanced heart failure. Post-systolic annular waves extending into mid-diastole (lower panel).
• An E/e' ratio may not be reliable in the presence of atrial fibrillation, sinus bradycardia and first degree AV block (Fig. 12.43).
• LV diastolic function can be deciphered through the evaluation not only of the relationship of the amplitude of E to e' but also through the evaluation of the relationship of the timing of the onset of E to the onset of e'. Normally, mitral inflow is initiated with rapid LV relaxation and 'suction' of blood into the LV. When this occurs, the onset of e' will be slightly before or simultaneous with the onset of E.25 If, however, LA pressure is elevated and LV relaxation reduced, E
velocity onset may precede the onset of e' (Fig. 12.44). These timing relationships have been correlated with LV filling pressure.
PULMONARY VEIN FLOW AND DIASTOLIC FUNCTION
PW Doppler flow pattern of pulmonary veins shows two over-riding antegrade systolic waves (mostly seen as one, S-wave), one antegrade diastolic wave (D) and a retrograde wave during atrial contraction, Ar (Figs 12.45 to 12.47). First S-wave is due to atrial relaxation and the

Fig. 12.43: E/e' ratio of 7 (lateral) in an 84-year-old person with sinus bradycardia, first degree AV block with heart failure.

Fig. 12.44: Mitral E preceding tissue e' in a patient with Grade II diastolic dysfunction.

Fig. 12.45: Pulmonary vein flow pattern in a normal subject. Patients with Grade I diastolic dysfunction have similar pattern.
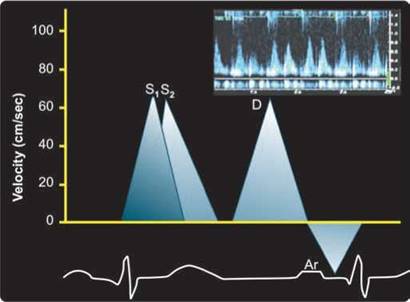
Fig. 12.46: Equivalent pulmonary systolic and diastolic wave but with prolonged atrial flow reversal (Ar) suggestive of diastolic dysfunction.
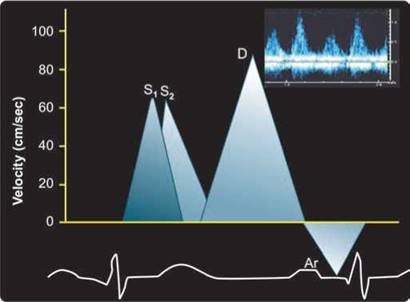
Fig. 12.47: Graphical representation of pulmonary vein flow in a subject with raised left ventricle filling pressure.
second one (S2) due to descent of the mitral annulus during systole. D-wave occurs during opened mitral valve. Ar-wave occurs following atrial contraction when blood has option of flowing antegradely into the LV as well as back in pulmonary veins depending upon the relative resistance.26
• The pattern of pulmonary venous flow (systolic vs. diastolic predominance) has been proposed as a predictor of diastolic dysfunction (Figs 12.48 and 12.49). However, diastolic preponderance is invariable in children and young adults.
• Ar velocity > 35 cm/s also indicates raised filling pressures (Fig. 12.49).
• Comparison of the duration of flow at atrial contraction across the mitral valve (on the mitral inflow velocity curve) and the duration of reversal flow back into the pulmonary veins (on the pulmonary venous velocity
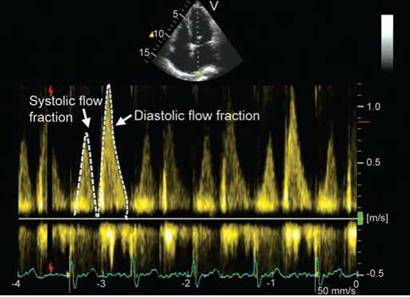
Fig. 12.48: Right upper pulmonary vein diastolic flow velocity and velocity-time integral is greater than systolic filling fraction in a patient with significant diastolic dysfunction.

Fig. 12.49: Right upper pulmonary vein atrial flow reversal (Ar) velocity of 50 cm/s indicative of diastolic dysfunction.

Fig. 12.50: Atrial flow reversal (Ar) duration of pulmonary vein > mitral A by > 30 milliseconds is suggestive of elevated LV end-diastolic pressure.
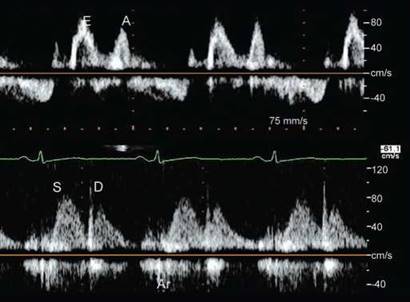
Fig. 12.51: Upper panel shows mitral flow pattern and the lower panel shows right upper pulmonary flow pattern. In the presence of normal-appearing mitral flow, predominant systolic fraction and short atrial flow reversal (Ar) indicate that the above pattern is of a normal adult.
curves) has been repeatedly demonstrated to reflect the left ventricular end-diastolic pressure (Fig. 12.50).
• If the duration of atrial reversal flow in the pulmonary vein exceeds by more than 30 milliseconds the duration of flow across the mitral valve, raised left ventricular end-diastolic pressure can be diagnosed with high specificity.
• the major limitations to the use of the pulmonary venous signals are that these signals are difficult to obtain and interpret. the technical feasibility of obtaining adequate signals has been reported at < 80% of unselected patients.
• Pulmonary vein flow, when interpretable, is used to refining the grades of diastolic dysfunction (Figs 12.51 to 12.53).
• Longer duration of mitral atrial flow compared to that of pulmonary vein atrial flow reversal velocity may be found in Grade I diastolic dysfunction besides in normal subjects.
Acquisition of Pulmonary Vein Flow Signals
• Color flow imaging is useful for the proper location of the sample volume in the right upper pulmonary vein.

Fig. 12.52: Equivalent pulmonary venous systolic and diastolic flow fraction (lower panel) but with inspiratory decrease in D-wave (arrow) is suggestive of normal filling pattern.
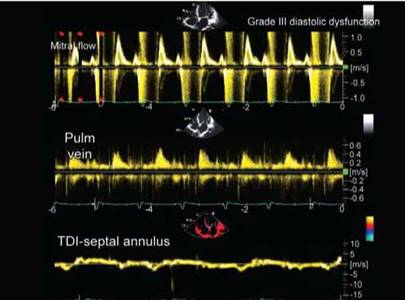
Fig. 12.53: Upper panel: mitral flow, middle panel: pulmonary flow, lower panel: septal annular velocities. There is hardly any S-wave in pulmonary vein flow and E/e' of 30 indicating advanced diastolic dysfunction.
• In most patients, the best Doppler recordings are obtained by angulating the transducer superiorly such that the aortic valve is seen.
• A 2- to 3-mm sample volume is placed > 0.5 cm into the pulmonary vein for optimal recording of the spectral waveforms.
• Wall filter settings must be low enough to display the onset and cessation of the Ar velocity waveform.
• Pulmonary venous flow can be obtained in > 80% of ambulatory patients, although the feasibility is much lower in the intensive care unit setting.
• the major technical problem is LA wall-motion artifacts, caused by atrial contraction, which interferes with the accurate display of Ar velocity.
• Spectral recordings should be obtained at a sweep speed of 50-100 mm/s at end-expiration and measurements include the average of three or more consecutive cardiac cycles.
Pulmonary Vein Flow Parameters
• Measurements of pulmonary venous waveforms include peak systolic (S) velocity, peak anterograde diastolic (D) velocity, the S/D ratio, systolic and diastolic filling fractions, and the peak Ar velocity in late diastole.
• Other measurements are the duration of the Ar velocity, the time difference between it and mitral A-wave duration (Ar-A).
• D velocity DT. ttere are two systolic velocities (S1 and S2), mostly noticeable when there is a prolonged
PR interval, because S1 is related to atrial relaxation. S2 should be used to compute the ratio of peak systolic to peak diastolic velocity.
• S1 velocity is primarily influenced by changes in LA pressure and LA contraction and relaxation, whereas S2 is related to stroke volume and PW propagation in the pulmonary arterial tree.
• D velocity is influenced by changes in LV filling and compliance and changes in parallel with mitral E velocity.
• Pulmonary venous Ar velocity and duration are influenced by LV late diastolic pressures, atrial preload and LA contractility.
• A decrease in LA compliance and an increase in LA pressure decrease the S velocity and increase the D velocity, resulting in an S/D ratio < 1, systolic filling fraction < 40% and shortening of the DT of D velocity, usually < 150 milliseconds (Figs 12.54 and 12.55).
• However, DT of mitral E and pulmonary vein D may not always be concordant as DT of D-wave tends to be nonlinear more often (Fig. 12.56).
MITRAL flow propagation BY color M-MQPE
Assessment of flow propagation into the LV is another technique that provides better ability to predict filling pressures.27,28
In the normal state, flow rapidly propagates into the LV (Fig. 12.57). Early stage relaxation abnormalities show a blunting of flow propagation.

Fig. 12.54: Upper panel: pulmonary vein flow, lower panel: transmitral flow. Restrictive transmitral flow is negated by normal pulmonary venous flow, although atrial flow reversal is 20 milliseconds longer.
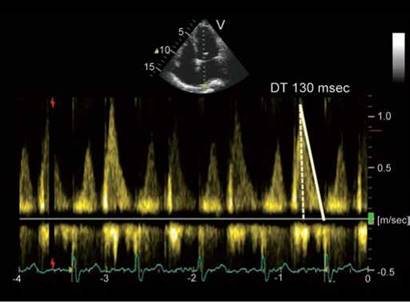
Fig. 12.55: Pulmonary vein D-wave > S-wave with deceleration time of 130 milliseconds indicating elevated left ventricular filling pressure.
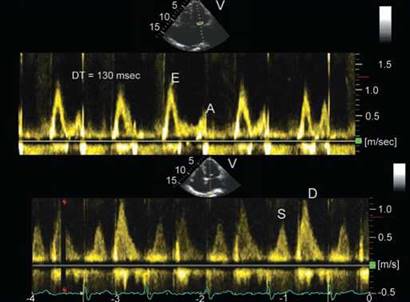
Fig. 12.56: Upper panel shows short deceleration time (DT) of mitral E, while DT of pulmonary vein D is longer (170 milliseconds) and nonlinear.
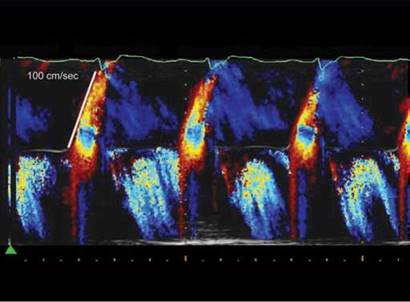
Fig. 12.57: Mitral flow propagation velocity by M-mode.
The propagation velocity (Vp) does not show a pseudonormalization, and therefore, can be used in all levels of diastolic dysfunction.
Similar to the tissue Doppler velocities, color M-mode flow propagation has been combined in a ratio with the mitral E velocity to provide an 'adjusted' parameter (E/Vp) with strong correlation to filling pressures and prognosis.
The chief limitations of this tool are lack of consensus on technique and theoretical concerns that this will be invalid in small left ventricular cavities.
• Acquisition is performed in the apical four-chamber view, using color-flow imaging.
• M-mode scan line is placed through the center of the LV inflow blood column from the mitral valve to the apex, with baseline shift to lower the Nyquist limit so that the central highest velocity jet is blue.
• Vp is measured as the slope of the first aliasing velocity during early filling, measured from the mitral valve

Fig. 12.58: Vp of 31 cm/s in a patient with heart failure.
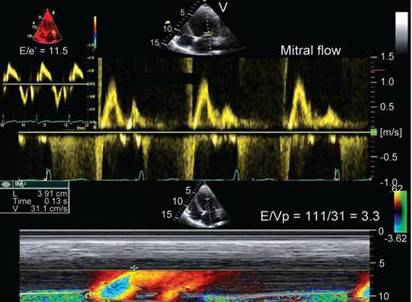
Fig. 12.59: A 43-year-old female with recurrent pulmonary edema. E/e' of 12.5 (lateral) is inconclusive but E/Vp of 3.3 suggests raised filling pressures.
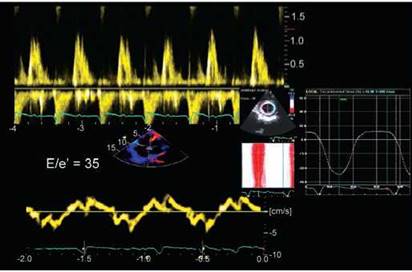
Fig. 12.60: Normal circumferential strain (right panel) in presence of advanced diastolic dysfunction.
plane to 4 cm distally into the LV cavity, or the slope of the transition from no color to color.
• Vp > 45-50 cm/s is considered normal (Fig. 12.58).
• Should other Doppler indices appear inconclusive, an E/Vp ratio > 2.5 predicts PCWP > 15 mm Hg with reasonable accuracy (Fig. 12.59).
• Patients with normal LV volumes and EFs but elevated filling pressures can have misleadingly normal Vp.
• Peak velocity of early diastolic mitral flow propagation velocity (Vp) has been used as an approximation for ventricular suction.
LONGITUDINAL STRAIN, ROTATION AND UNTWISTING RATE BY ACOUSTIC SPECKLE TRACKING
• Most patients with diastolic dysfunction have impaired longitudinal strain by acoustic speckle tracking. Impaired longitudinal strain (> -15%) is the first indication of impaired diastolic function.29
• Torsion and circumferential strain are normal in patients with isolated diastolic dysfunction (Fig. 12.60).
• Assessment of LV torsion has shown that untwisting begins before aortic valve closure and might be an important component of normal diastolic filling.28
• Studiesinhumansubjectsusing indirectindexes derived from right heart catheterization have suggested a relationship between constant of isovolumic relaxation and measures of untwisting.
• But the relationship between directly measured diastolic function indexes with micromanometer catheters and untwisting parameters has not been established in human subjects.
• Untwisting parameters are related to invasive indexes of LV relaxation and suction but not to LV stiffness. These data suggest that untwisting is an important component of early diastolic LV filling but not of later diastolic events.

Fig. 12.61: Diastolic stress test in a normal person. There is proportionate increase in mitral E and e'.

Fig. 12.62: A simplified schema to report diastolic function based upon pulsed wave Doppler mitral flow, annular velocities and pulmonary vein flow.
(DTI: Doppler tissue imaging).
diastolic stress test
Many patients present with exertional dyspnea but have normal LV filling pressures at rest.
In these patients, it is important to evaluate filling pressure with exercise.30,31
Exercise can be performed using a supine bicycle or treadmill protocol.
Because most patients have limited functional capacity, the workload starts at 25 W and increases in increments of 25 W every 3 minutes.
We need to record mitral inflow by pulsed Doppler echocardiography at the level of the mitral tips, mitral annular velocities by spectral Doppler echocardiography and tricuspid regurgitation jet by CW Doppler (Fig. 12.61).
summary
Doppler echocardiography provides major insights into the pathophysiology of diastolic LV dysfunction. So far, however, no single Doppler echocardiographic index of diastolic LV dysfunction has yielded a robust criterion for elevated LV filling pressures. A stepwise strategy with sequential use of multiple Doppler echocardiographic indexes reduces diagnostic sensitivity because it frequently leads to an indeterminate outcome. A multiparametric approach with age and clinical situation in mind is the best way of using echocardiography in detection of diastolic dysfunction because it is so complex and dependent upon multitude of variables (Fig. 12.62). Because of these persistent shortcomings, clinicians should continue to make critical use of current Doppler echocardiographic estimates of LV filling pressures and should not hesitate to implement invasive investigations to confirm their
clinical suspicions. Guidelines for assessing diastolic function by echocardiography are continually being updated. There is reasonable agreement estimating diastolic grade and LA pressure using current guidelines. Further refinements in the definition of mild and moderate dysfunction may improve agreement. There are a number of limitations to these measurements, including the need for high-quality signals, adequate flow visualization in the apical views, experience in acquisition and analysis, and so on.
1. Spevack DM, Karl J, Yedlapati N, et al. Echocardiographic left ventricular end-diastolic pressure volume loop estimate predicts survival in congestive heart failure. J Card Fail. 2013;19(4):251-9.
2. Nagueh SF, Appleton CP, Gillebert TC, et al. Recommendations for the evaluation of left ventricular diastolic function by echocardiography. Eur J Echocardiogr. 2009;10:165-93.
3. Chapman CB, Ewer SM, Kelly AF, et al. Classification of left ventricular diastolic function using american society of echocardiography guidelines: agreement among echocar- diographers. Echocardiography. 2013;30(9):1022-31.
4. Dokainish H, Nguyen JS, Bobek J, et al. Assessment of the American Society of Echocardiography-European Association of Echocardiography guidelines for diastolic function in patients with depressed ejection fraction: an echocardiographic and invasive haemodynamic study. Eur J Echocardiogr. 2011;12(11):857-64.
5. Martos R, Baugh J, Ledwidge M, et al. Diastolic heart failure: evidence of increased myocardial collagen turnover linked to diastolic dysfunction. Circulation. 2007;115(7):888-95.
6. Granzier HL, Labeit S. The giant protein titin: a major player in myocardial mechanics, signaling, and disease. Circ Res. 2004;94(3):284-95.
7. Gillebert TC, De Pauw M, Timmermans F. Echo-Doppler assessment of diastole: flow, function and haemodynamics. Heart. 2013;99(1):55-64.
8. Oh JK, Tajik J. The return of cardiac time intervals: the phoenix is rising. J Am Coll Cardiol. 2003;42(8):1471-4.
9. Nishimura RA, Appleton CP, Redfield MM, et al. Noninvasive doppler echocardiographic evaluation of left ventricular filling pressures in patients with cardiomyopathies: a simultaneous Doppler echocardiographic and cardiac catheterization study. J Am Coll Cardiol. 1996;28(5): 1226-33.
10. Little WC, Ohno M, Kitzman DW, et al. Determination of left ventricular chamber stiffness from the time for deceleration of early left ventricular filling. Circulation. 1995;92(7): 1933-9.
11. Rossvoll O, Hatle LK. Pulmonary venous flow velocities recorded by transthoracic Doppler ultrasound: relation to left ventricular diastolic pressures. J Am Coll Cardiol. 1993;21(7):1687-96.
12. Lam CS, Han L, Ha JW, et al. The mitral L wave: a marker of pseudonormal filling and predictor of heart failure in patients with left ventricular hypertrophy. J Am Soc Echocardiogr. 2005;18(4):336-41.
13. Dini FL, Galderisi M, Nistri S, et al. Abnormal left ventricular longitudinal function assessed by echocardiographic and tissue Doppler imaging is a powerful predictor of diastolic dysfunction in hypertensive patients: The SPHERE study. Int J Cardiol. 2013;[Epub Ahead of Print].
14. Lam CS, Han L, Oh JK, et al. The mitral annular middiastolic velocity curve: functional correlates and clinical significance in patients with left ventricular hypertrophy. J Am Soc Echocardiogr. 2008;21(2):165-70.
15. Tsang TS, Barnes ME, Gersh BJ, et al. Left atrial volume as a morphophysiologic expression of left ventricular diastolic dysfunction and relation to cardiovascular risk burden. Am J Cardiol. 2002;90(12):1284-9.
16. Aljaroudi W, Alraies MC, Halley C, et al. Effect of age, gender, and left ventricular diastolic function on left atrial volume index in adults without known cardiovascular disease or risk factors. Am J Cardiol. 2013;111:1517-22.
17. Khan UA, de Simone G, Hill J, et al. Depressed atrial function in diastolic dysfunction: a speckle tracking imaging study. Echocardiography. 2013;30(3):309-16.
18. Nagueh SF, Middleton KJ, Kopelen HA, et al. Doppler tissue imaging: a noninvasive technique for evaluation of left ventricular relaxation and estimation of filling pressures. J Am Coll Cardiol. 1997;30(6):1527-33.
19. Nishimura RA, Tajik AJ. Evaluation of diastolic filling of left ventricle in health and disease: Doppler echocardiography is the clinician's Rosetta Stone. J Am Coll Cardiol. 1997;30(1):8-18.
20. Kitabatake A, Inoue M, Asao M. Transmitral blood flow reflecting diastolic behavior of the left ventricle in health and disease-a study by pulsed Doppler technique. Jpn Circ J. 1982;46:92-102.
21. Pinamonti B, Zecchin M, Di Lenarda A, et al. Persistence of restrictive left ventricular filling pattern in dilated cardiomyopathy: an ominous prognostic sign. J Am Coll Cardiol. 1997;29(3):604-12.
22. Ommen SR, Nishimura RA, Appleton CP, et al. Clinical utility of Doppler echocardiography and tissue Doppler imaging in the estimation of left ventricular filling pressures: A comparative simultaneous Doppler-catheteri- zation study. Circulation. 2000;102(15):1788-94.
23. Oki T, Tabata T, Yamada H, et al. Clinical application of pulsed Doppler tissue imaging for assessing abnormal left ventricular relaxation. Am J Cardiol. 1997;79:921-8.
24. Wang J, Khoury DS, Thohan V, et al. Global diastolic strain rate for the assessment of left ventricular relaxation and filling pressures. Circulation. 2007;115(11):1376-83.
25. Rivas-Gotz C, Khoury DS, Manolios M, et al. Time interval between onset of mitral inflow and onset of early diastolic velocity by tissue Doppler: a novel index of left ventricular relaxation: experimental studies and clinical application. J Am Coll Cardiol. 2003;42(8):1463-70.
26. Smiseth OA, Thompson CR, Lohavanichbutr K. The pulmonary venous systolic flow pulse—its origin and relationship to left atrial pressure. J Am Coll Cardiol. 1999;34: 802-9.
27. Rivas-Gotz C, Manolios M, ttohan V et al. Impact of left ventricular ejection fraction on estimation of left ventricular filling pressures using tissue Doppler and flow propagation velocity. Am J Cardiol. 2003;91(6):780-4.
28. Brun P, Tribouilloy C, Duval AM. Left ventricular flow propagation during early filling is related to wall relaxation: a color M-mode Doppler analysis. J Am Coll Cardiol. 1992;20:420-32.
29. van Heerebeek L, Borbely A, Niessen HW. Myocardial structure and function differ in systolic and diastolic heart failure. Circulation. 2006;113:1966-73.
30. Ha JW, Oh J, Pellikka P, et al. Diastolic stress echocardiography: a novel noninvasive diagnostic test for diastolic dysfunction using supine bicycle exercise Doppler echocardiography. J Am Soc Echocardiogr. 2005;18:63-8.
31. Nasim S, Nadeem N, Zahidie A, et al. Relationship between exercise induced dyspnea and functional capacity with doppler-derived diastolic function' BMC Res Notes. 2013;6(1):150.