INTRODUCTION
Pericardium is a double-layered sac with minimal fluid which covers the heart and the base of great vessels. It fixes the heart to the mediastinum, acts as a protective barrier against infections, prevents excessive dilatation and offers lubrication during movements. The common disorders that affect pericardium are its partial absence, acute pericarditis, pericardial effusion (PE), cardiac tamponade, constrictive pericarditis (CP), pericardial tumors and so on. Echocardiography provides a useful tool to detect, treat and monitor the progress of pericardial diseases.

Fig. 18.1: Graphic representation of the conical fibroserous sac of pericardium (white solid line) and the structure contained by it besides the heart. (SVC: Superior vena cava; IVC: Inferior vena cava; AO: Aorta; PT: Pulmonary trunk).
ECHOCARDIOGRAPHIC ANATOMY OF PERICARDIUM
• Pericardium is a double layered membrane which covers the heart. It is placed behind the sternum and the cartilages of the third, fourth, fifth, sixth and seventh ribs of the left side, in the mediastinal cavity.1
• The space between the two layers of it is filled with a pericardial fluid (15-50 mL) that protects the heart from any kind of external jerk or shock (Figs 18.1 and 18.2).
• There are two layers to the pericardial sac: the outermost fibrous pericardium and the inner serous pericardium.
• The serous pericardium, in turn, is divided into two layers, the parietal pericardium, which is fused to and
inseparable from the fibrous pericardium, and the visceral pericardium, which is part of the epicardium (Fig. 18.3).
• The epicardium is the layer immediately outside of the myocardium.
• The visceral layer extends to the beginning of the great vessels, becoming one with the parietal layer of the serous pericardium. This happens at two areas; where the aorta and pulmonary trunk leave the heart and where the superior vena cava, inferior vena cava (IVC) and pulmonary veins enter the heart.

Fig. 18.2: Frontal View: Outline of the pericardial space by injecting a small amount of contrast in a normal person. White arrow shows posterior interventricular groove.

Fig. 18.3: Separation of two layers of pericardium in a subject with fluid collection in the pericardial space.
(AV: Atrioventricular; RV: Right ventricular; LV: Left ventricular; AO: Aorta; LA: Left atrium).

Fig. 18.4: Pericardium outlined by its calcification in left anterior oblique view. It rests on diaphragm below and is separated from the spine by the oesophagus and the descending thoracic aorta.

Fig. 18.5: Chest Skiagram in lateral view of thorax showing relationship of the pericardium. The arrows point toward pericardial calcification that posteriorly ends in atrioventricular groove.
• In between the parietal and visceral pericardial layers there is a potential space called the pericardial cavity. It is normally lubricated by a film of pericardial fluid (Fig. 18.2).
• Anteriorly, it is separated from the anterior wall of the thorax, in the greater part of its extent, by the lungs and pleurae.
• Posteriorly, it rests upon the bronchi, the oesophagus, the descending thoracic aorta and the posterior part of the mediastinal surface of each lung (Figs 18.4 and 18.5).
• Laterally, it is covered by the pleurae, and is in relation with the mediastinal surfaces of the lungs;
the phrenic nerve, with its accompanying vessels, descends between the pericardium and pleura on either side.
the principal manifestations of pericardial disease are:
• Acute pericarditis.
• Pericardial effusion.
• Cardiac tamponade.
• Transient or irreversible CP.
• Pericardial calcification.
• Invasion by neoplastic diseases.

Fig. 18.6: Transthoracic apical 4-CV showing apical dyskinesis with thrombus, T (acute anterior myocardial infarction). Yellow arrow points toward pericardial effusion.

Fig. 18.7: Parasternal short-axis view showing site of left ventricular rupture (arrow) with localized pericardial hematoma (PE).

Fig. 18.8: Pericardial effusion (arrows) with typical clinical picture of acute pericarditis in an elderly female with hypothyroidism.
• Pericardial cysts.
• Pericardial hematoma (e.g. in cardiac rupture, aortic dissection, etc.)
Acute pericarditis and PE are two distinctly different clinical entities, which on occasion may be present simultaneously. In some cases, the clinical presentation of acute pericardial inflammation predominates, and the presence of excess pericardial fluid is clinically unimportant. In other cases, the effusion and its clinical consequences (cardiac tamponade) are of primary importance.
the major causes of pericardial diseases include:
• Viral infection.
• Pyogenic pericarditis.
• Tuberculosis.
• Myocardial infarction (Figs 18.6 and 18.7).
• Cardiac surgery.
• Recent or remote sharp or blunt chest trauma.
• Cardiac diagnostic or interventional procedure.
• Drugs and toxins.
• Metabolic disorders, especially uraemia, dialysis and hypothyroidism.
• Malignancy, especially lung and breast cancer, Hodgkin lymphoma and mesothelioma.
• Mediastinal radiation, recent or remote.
• Collagen vascular diseases.
• Idiopathic.
• Rheumatic fever.
Pericardial disease may also be a feature of other disorders, including inflammatory bowel disease and familial Mediterranean fever. Aortic dissection or free wall rupture should also be considered in patients with unstable hemodynamics and PE.
ACUTE PERICARDITIS AND PERICARDIAL EFFUSION
Acute pericarditis refers to inflammation of the pericardial sac. Acute pericarditis is a common disorder caused by inflammation of the pericardium and can occur as an isolated entity or as a manifestation of an underlying systemic disease (Fig. 18.8).
• Acute pericarditis is diagnosed in approximately 0.1% of hospitalized patients and in 5% of patients admitted to the emergency department with noncardiac chest pain (Fig. 18.8).

Fig. 18.9: Transthoracic echocardiographic parasternal long-axis view showing mild pericardial effusion (PE) in a patient on maintenance hemodialysis. Typical signs of pericarditis were present.

Fig. 18.10: Transthoracic parasternal short-axis view. Pericardial effusion (arrows) in a 44-year old female with endomyocardial fibrosis.
• Initial evaluation includes a clinical history and physical examination, electrocardiographic (ECG), echocardiography, chest radiography and lab studies. At least two of the following four criteria should be present to diagnose pericarditis:2
- Characteristic chest pain
- Pericardial friction rub
- Suggestive ECG changes
- New or worsening PE
• In most patients, the cause of acute pericarditis is thought to be idiopathic because the yield of diagnostic tests to confirm aetiology has been relatively low.
• The term myopericarditis, or perimyocarditis, is used for cases of acute pericarditis that also demonstrate myocardial inflammation. The term myopericarditis indicates a primarily pericardial syndrome with minor myocardial involvement, which describes the majority of combined pericarditis and myocarditis cases encountered in clinical practice. On the other hand, the term perimyocarditis indicates a primarily myocardial syndrome.3-4 However, these two terms are often used interchangeably without regard to the predominant type of cardiac involvement (Fig. 18.9). Myocarditis is common in acute pericarditis especially with viral etiology but also in other inflammatory and systemic disorders (Fig. 18.10).
Echocardiography aids in the detection, localization and quantification of PE.
The appearance of the normal pericardium in M-mode or two-dimensional echocardiography is that of a bright,
dense layer of echoes inseparable from the epicardial echo with a thickness of about 2 mm.
• The sensitivity of echocardiography in detecting pericardial fluid is very high and even 20 mL of fluid inside the pericardium may be visualized.5 Since even healthy individuals occasionally may have up to 50 mL of pericardial fluid, echocardiographic visualization of a very small amount of pericardial fluid (in an otherwise healthy individual) should not be cause for concern (Fig. 18.11).
• The size of the effusion may be graded as:5-7
- Small (echo-free space in diastole < 10 mm, corresponding approximately to 300 mL).
- Moderate (10-20 mm, corresponding to 500 mL).
- Large (> 20 mm, > 700 mL) (Fig. 18.12).
• Alternatively, Horowitz et al.8 classified PE as:
Type A: No effusion.
Type B: Systolic separation of epicardium and pericardium (3-16 mL).
Type C1: Systolic and diastolic separation of epicardium and pericardium (> 16 mL).
Type C2: Systolic and diastolic separation of pericardium with attenuated pericardial motion.
Type D: Pronounced separation of epicardium and pericardium with large echo-free space.
Type E: Pericardial thickening (> 4 mm).
Important points for estimating PE are:
• Even in diffused and circumferential effusion dimensions of the echo-free space may be different

Fig. 18.11: M-mode cross-section of a healthy 19-year old boy showing separation of two layers of pericardium with some fluid (arrow).

Fig. 18.12: Comparing mild versus large pericardial effusion.

Fig. 18.13: Localized pericardial effusion (PE) (arrow) adjacent to the lateral wall.

Fig. 18.14: Pericardial fluid reflecting at posterior atrioventricular groove (arrow) in parasternal long-axis view.
(PE: Pericardial effusion).
in the examined views and therefore it is more correct and easy to measure and annotate the dimension of the effusion and to report where it has been.
This methodology not only facilitates the definition of effusion size, but it allows follow-up studies, detecting changes in the amount of pericardial fluid after therapy.
• Most PEs are circumferential, and therefore moderate and large effusions in particular result in echo-free spaces along the entire heart profile in the different views.
• Small or loculated effusion (Fig. 18.13) may be observed only in the posterior regions or (particularly iatrogenic and postsurgical effusion) along one or more heart
regions (more frequently along the right side of the heart).
• With regard to technical rules it is important to visualize the pericardium from as many planes as possible, including off-axis views, and to utilize the gray scale and gain settings correctly.
• A small PE may be more precisely defined by setting the gain low so that only the posterior pericardium is seen.
• In the parasternal long-axis view pericardial fluid reflects at the posterior atrioventricular groove (Fig. 18.14), while pleural fluid continues under the left atrium, posterior to the descending aorta.

Fig. 18.15: Paradoxical motion of interventricular septum (IVS) in a large pericardial effusion (PE) seen in M-mode section.
(PW: Posterior wall).

Fig. 18.16: M-mode section of the ventricles showing swinging heart with all walls moving forward in diastole and backward in systole.
(PE: Pericardial effusion).

Fig. 18.17: Arrows point to intrapericardial bands in a patient with tubercular pericardial effusion in apical 4-CV.
(RV: Right ventricular; LV: Left ventricular; RA: Right atrial; LA: Left atrial)

Fig. 18.18: Apical 4-CV showing large pericardial effusion (PE) with a band (arrow) in a 19-year old boy with fever of 2 weeks duration.
• In large PEs, the heart may move freely within the pericardial cavity (“swinging heart”) inducing pseudoprolapse and pseudosystolic anterior motion of the mitral valve, paradoxical motion of the interventricular septum and midsystolic aortic valve closure (Figs 18.15 and 18.16).
Large effusions generally indicate more serious disease. Intrapericardial bands, combined with a thick visceral or parietal pericardium are often found after radiation of the chest, tubercular or pyogenic PE (Figs 18.17 and 18.18).
Rarely granulomatous masses are found within the pericardium and may masquerade as tumors (Fig. 18.19).
Echocardiographic Masqueraders of PE:
• Hematoma (Fig. 18.7).
• Cysts.
• Foramen of Morgagni hernia.
• Hiatus hernia.
• Lipodystrophia with paracardial fat.
• Left pleural effusion (Fig. 18.20).
• Mitral annulus calcification.
• Giant left atrium.
• Epicardial fat best differentiated in computerized tomography (CT).
• Left ventricular pseudoaneurysm (Fig. 18.21).

Fig. 18.19: Cresentic intrapericardial mass (arrow) with pericardial effusion (PE).

Fig. 18.20: Large left-sided pleural effusion, which reflects behind the left atrium, compared to small pericardial effusion, which reflects in posterior atrioventricular groove.

Fig. 18.21: Left ventricular pseudoaneurysm (arrow) masquerading as a pericardial effusion in a surgically proven case. The neck of the pseudoaneurysm was serpigenous at the junction of apical and mid-lateral wall.

Fig. 18.22: Relationship between intrapericardial pressure and intrapericardial volume depending upon speed of fluid accumulation.
Cardiac tamponade is defined as a significant compression of the heart by accumulating pericardial contents (effusion fluids, clots, pus and gas), alone or in combination.9
Normally intrapericardial pressure is zero or slightly negative and the transmural pressure gradient across the myocardium during diastole is positive, thus facilitating ventricular filling. The accumulation of fluids into the pericardial cavity causes an increase of both the intrapericardial and intracardiac pressures and impedes diastolic filling.10
There is dissociation between intrathoracic and intracardiac pressures also.
Important points to remember are:
• It is not the amount of fluid but the rapidity with which it accumulates that decides the hemodynamic effects (Fig. 18.22).
• Sudden fluid, blood or pus accumulation in the pericardial sac can cause rise in intrapericardial and right and left atrial pressures even if the accumulated content is less than 50 mL (Fig. 18.23).
• Under normal physiologic conditions, the intrapericardial pressure is equal to intrapleural pressure and

Fig. 18.23: M-mode Echocardiogram of a patient with cardiac tamponade during percutaneous coronary intervention. There is evidence of right ventricular compression with marked tachycardia and no respiratory variation even though there is small expansion of the pericardial space.

Fig. 18.24: Apical 4-CV showing large pericardial effusion with right atrial collapse (arrow).

Fig. 18.25: Parasternal long-axis view showing pericardial effusion (PE) and diastolic right ventricular collapse (arrow).

therefore negative. the elevation of the intrapericardial pressure is the result of rapid or slow accumulation of fluid, gas or tissue within the pericardial cavity. As the pericardial contents initially increase, the pericardial space accommodates the expanding volume of material without an increase in pressure or compromise of the cardiac chambers until the limit of the pericardial reserve volume is reached. Slow or gradual accumulation of pericardial fluid of up to 1,000-1,500 mL can be tolerated without hemo dynamic impairment.
• An abnormally thickened pericardium may have a much lower threshold for increases in pressure that lead to tamponade due to its inability to expand normally to accommodate an increasing intrapericardial volume.
• Right atrial collapse,11-13 which occurs in late diastole or early systole, reflects increased intrapericardial pressure inverting the right atrial wall inward when the right atrial pressure is lowest (Fig. 18.24).
• This echocardiographic sign of right atrial collapse has a reported sensitivity of 55-60% and specificity of 50-68% for tamponade. Right atrial collapse is more specific if the inward movement lasts for at least 30% of the cardiac cycle.13
• Right ventricular collapse,12 which occurs in early diastole, is a less sensitive (38-48%) but more specific

Fig. 18.26: Transthoracic apical 4-CV showing diastolic left atrial collapse while there is no collapse of the right atrial free wall.

Fig. 18.27: Transthoracic parasternal long-axis view showing left ventricular (LV) collapse due to localized pericardial effusion (PE).

Fig. 18.28: Spontaneous echo contrast in inferior vena cava (IVC).
(84%-100%) finding for cardiac tamponade (Fig. 18.25). However, it has been considered a late sign.
• Collapse of the left atrium,14-15 which takes place in late diastole, may occur in approximately 25% of patients and is highly specific for tamponade (Fig. 18.26).
• Left ventricular collapse16 also has low sensitivity and usually occurs under specific circumstances such as localized postsurgical tamponade (Fig. 18.27).
• Another echocardiographic sign for tamponade is a distended IVC or IVC plethora. Normally, the proximal IVC decreases by more than 50% in diameter after a deep inspiration or a sniff. In tamponade, by definition the right atrial pressure is elevated and the IVC typically is distended and will not decrease
in diameter with these maneuvers.17 However, IVC plethora is not a specific finding for tamponade and may be present in other conditions causing elevated right atrial pressure. Markedly raised right atrial pressure in tamponade occasionally results in spontaneous contrast in IVC (Fig. 18.28).
Abnormal Doppler flow has a good correlation with clinical features of tamponade, with a higher sensitivity (75-80%) than right ventricular collapse and a much higher specificity (91%) than right atrial collapse.18-20 Marked respiratory variation in Doppler velocities, the so-called Doppler flow velocity paradoxus, is a pattern of reciprocal variation in the left-sided and right-sided transvalvular inflow velocities (Fig. 18.29).
Normally, there is no significant respiratory variation in early diastolic filling velocities across the tricuspid and mitral valves (Fig. 18.30).
In tamponade, however, there may be an exaggerated “paradoxical” increase in right-sided inflow velocities with an exaggerated decrease in left-sided inflow velocities (Fig. 18.31).
Other recently described echocardiographic signs in tamponade include compression oftwo intrapericardial structures, the pulmonary trunk and the thoracic IVC. The pulmonary trunk is an entirely intrapericardial short and wide vessel. The short intrathoracic segment of the IVC is extrapericardial in its posterior aspect but is covered by pericardium on its anterior aspect. ttis is the reason why in PE with tamponade, there is indentation of the right atrium at the level of the IVC junction anteriorly but not posteriorly.

Fig. 18.29: Velocity flow paradoxus across mitral (left) and tricuspid valve (right) in a patient with cardiac tamponade.

Fig. 18.30: Transmitral flow velocities with respiratory signal in a normal person. There is hardly any respiratory variation of early diastolic velocities.

Fig. 18.31: Left panel shows large pericardial effusion (PE) in parasternal long-axis view while the right panel shows greater than 25% respiratory variation with inspiratory decrease in early diastolic mitral inflow velocities suggesting cardiac tamponade.

Fig. 18.32: Continuous Doppler interrogation of the aortic flow in a patient with cardiac tamponade. Note greater than 40% inspiratory decrease in systolic velocities.
• Aortic flow frequently exhibits pulsus paradoxus or significantly decreased inspiratory systolic flow velocities that is equivalent of clinical pulsus paradoxus observed (Fig. 18.32). 21
• One mechanism of pulsus paradoxus is also visible at echocardiography when both the ventricular and atrial septa move sharply to the left with an increase in right chamber volumes at the expense of the left chambers. The reverse occurs in expiration. This paradoxical motion of the septa occurs because each side of the heart fills at the expense of the other due to the fixed intrapericardial volume.
• As more fluid is added to the cavity, cardiac stroke volume falls and there is compensatory tachycardia to maintain cardiac output.22
• Even in cases with diffuse circumferential effusion the hemodynamic effects of tamponade are due primarily to right heart compression. This is because right heart filling pressures are lower than that of the left and are easily overcome by the rising intrapericardial pressure. Hence, sensitivity of right heart collapse in diagnosing tamponade is higher.
• Duration of the collapse should also be taken into account. Duration of collapse is directly related to

Fig. 18.33: Apical 4-CV in a patient with chronic constriction and calcification (arrow). The right panel is the graphic representation of the constriction.

Fig. 18.34: M-mode echocardiogram showing rapid expansion of the left ventricular posterior wall in early diastole (arrow) in a patient with constrictive pericarditis.
severity of tamponade and improves the specificity and predictive value of these diagnostic signs. With increasing severity, right atrial (RA) collapse tends to begin earlier and right ventricular (RV) collapse to extend later in diastole. Even though these two signs are too sensitive, the presence of both RA and RV collapses always indicates that the effusion is hemodynamically significant.
• From a technical point of view, it is important to control the positioning of the sample volume during the examination trying to exclude differences in location during respiration and to utilize the electrocardiography and respiratory signals.
• Occurrences of tamponade can be acute, subacute, regional or characterized by low pressure. Acute tamponade is sudden, life-threatening if not treated promptly and often associated with hypotension as well as chest pain and dyspnea.
PERICARDIAL CYSTS AND MASSES
Pericardial cysts can be congenital or inflammatory. Congenital cysts are uncommon, mostly unilocular and located at the right cardiodiaphragmatic angle, with a diameter from 1 cm to 5 cm, and clinically silent. However, sometimes they are associated with chest pain, dyspnea, cough and/or significant arrhythmias, due to the compression of the heart. Inflammatory cysts can be caused by rheumatic pericarditis, bacterial infection, particularly tuberculosis, trauma and cardiac surgery.
Most cysts are discovered accidentally on chest X-ray, or at echocardiography [particularly at transesophageal echocardiography (TEE)]. Usually, CT and magnetic resonance imaging (MRI) are diagnostic. Pericardial cysts are seen as an echolucent unilocular cavity that can cause extrinsic compression of the atrium. Sometimes, they may have a grossly heterogeneous echodense appearance on TEE, due to the collection of mucilaginous material or embryonic residua (bronchogenic cyst). Echinococcal cysts, usually originated from ruptured cysts in the liver and lungs, are the typical hydatid and multiseptate.
PERICARDIAL CONSTRICTION
When an inelastic pericardium impedes cardiac filling during diastole with exaggerated ventricular interdependence and dissociation between intrathoracic and intrapericardial pressures, it is labeled CP (Fig. 18.33).23-25 the types of constriction can be:
• Acute CP.
• Subacute constriction.
• Effusive CP.
• Chronic CP.
• Pericardial calcification with constriction.
Both CP and restrictive cardiomyopathy limit diastolic filling and result in diastolic heart failure, with relatively preserved global systolic function.26 In CP, diastolic filling is restricted by an inelastic pericardium after an initial expansion of the myocardium (Fig. 18.34). the upper limit of ventricular volume is constrained by an inflamed,

Fig. 18.35: Calcified pericardium restricting the transverse expansion of the heart with dilated left atrium.

Fig. 18.36: Intrinsic reduced myocardial compliance in restrictive cardiomyopathy (left panel) contrasted with reduced compliance in late diastole due to inelastic pericardium in constrictive pericarditis (right panel).

Fig. 18.37: Thickness of the posterior pericardium (arrows) at lowest possible gain by transthoracic echo may still be an overestimate.
scarred or calcified pericardium (Fig. 18.35) that is usually, but not always, thicker than normal.
Restrictive cardiomyopathy (Fig. 18.36) is defined by a nondilated ventricle with a rigid myocardium that causes a major decrease in the effective operative compliance of the heart muscle itself. This decrease distinguishes it from CP, in which no such decrease in myocardial compliance is usually seen.
Echocardiography is usually the initial diagnostic imaging and hemodynamic study in patients with suspected CP. Its diagnostic accuracy for CP has increased since characteristic hemodynamic changes and mitral
annulus motion were identified. Left ventricular systolic function as judged by the ejection fraction is typically normal but may be impaired in mixed constrictive- restrictive disease. Following are the echocardiographic observations in CP:
• Increased pericardial thickness measured with greater sensitivity by transesophageal echocardiography and cardiac CT than transthoracic echocardiography (Fig. 18.37).27
However, CP can occur without increased pericardial thickness in about 20% cases more so after surgery or radiation therapy.28
• Abnormal ventricular septal motion (Figs 18.38 to 18.40).
• Dilatation and absent or diminished collapse of the IVC and hepatic veins
• Restrictive mitral and tricuspid inflow velocities, typically (but not always) with respiratory variation (Figs 18.41 and 18.42).29-31
There may be no or insignificant respiratory variation of the early diastolic velocities in about 20% of CP because of markedly increased filling pressures due to greater severity of constriction.32 In such cases, preload manipulation can unmask respiratory variation (Fig. 18.44A).
Marked respiratory change in pulmonary vein flow is observed in CP. The S2 and D velocities increase, especially the D velocity, during expiration, and

Fig. 18.38: Diastolic fluttering of the interventricular septum (IVS) with exaggerated respiratory motion and septal bulging toward left ventricle (LV) during inspiration.
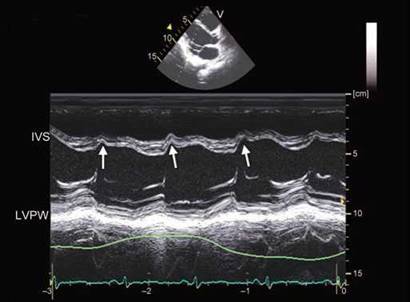
Fig. 18.39: Prominent early diastolic notch in interventricular septum (IVS) with concavity toward left ventricular in constrictive pericarditis. Normally, early diastolic notch in IVS is concave toward the right ventricular (RV) cavity due to beginning of RV filling after a delay in opening of the tricuspid valve compared to mitral valve.
(LVPW: Left ventricular posterior wall).

Fig. 18.40: Prominent early diastolic motion of the interventricular septum (IVS; arrow) with increased tissue velocity observed during expiration.

Fig. 18.41: Restrictive transmitral flow pattern on pulsed wave Doppler interrogation with marked respiratory variation.
decrease during inspiration. This is explained by incomplete transmission of the inspiratory fall of intrathoracic pressure to the LA. These changes are more prominent compared with changes in mitral inflow velocities. The combination of the S2/D ratio > 0.65 in inspiration and a respiratory variation of D velocity > 40% correctly classifies 80-85% of patients with CP (Fig. 18.44B).
• Preserved or increased medial mitral annulus early diastolic (e') velocity (Fig. 18.45), which is an important distinction from restrictive cardiomyopathy in which the e' is diminished with a cut-off value of 8 cm/s.
Sensitivity of e' > 8 cm/sec in detecting CP is 89% while the specificity is 95%.33-35
However, e' may be reduced in CP in presence of myocardial disease, patchy fibrosis or extensive calcification.
• Increased hepatic vein flow reversal with expiration, reflecting the ventricular interaction and the dissociation of the intracardiac and intrathoracic pressures (Fig. 18.46).36
• Annulus paradoxus: Normally, mitral flow early diastolic velocity (E) to tissue early diastolic velocity (e') ratio is a good index of pulmonary capillary wedge
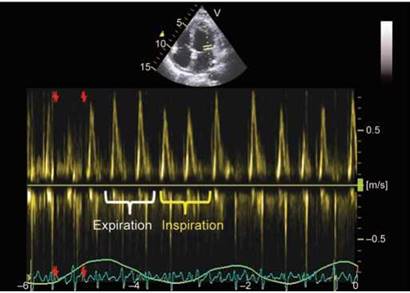
Fig. 18.42: Decreasing mitral flow early diastolic velocities during inspiration with corresponding increase during expiration.

Fig. 18.43: Dissociation between intrapericardial (intracardiac) versus intrathoracic pressures explaining the respiratory variation inflow velocities of mitral valve and pulmonary veins. (PCW: Pulmonary capillary wedge pressure; IP: Intrapericardial pressure).

Figs 18.44A and B: Transmitral early diastolic velocities during quiet respiration in left lateral position (left panel) and after standing (right panel). Standing induces preload reduction and sometimes may restore respiratory variation in constriction; (B) Respiratory variation in right upper pulmonary vein flow in constrictive pericarditis.

Fig. 18.45: Surgically proven CP with mitral tissue e' velocity of 20 cm/sec due to enhanced longitudinal LV expansion.
pressure. E/e' increases with increasing LV filling pressure (Fig. 18.47). This relationship gets reversed in CP and has been labeled as “annulus paradoxus’!37
ttis is because e' remains normal or is enhanced with increasing severity of constriction due to unidirectional (longitudinal) diastolic expansion of the LV in early diastole (Fig. 18.48).
Annulus reversus: In CP, mitral medial early diastolic (e') velocity is preserved or even increased because of the limitation of lateral expansion by the constricting pericardium, and mitral lateral e' velocity tends to be lower than medial e' velocity, which is a reversal of their normal relationship.38 The mitral lateral/medial e' ratio is reversed in three fourths of patients with CP (Figs 18.49 and 18.50). After pericardiectomy, there is
reduction of all annular velocities and normalization of the mitral lateral/medial e' ratio.
• Tissue velocity diastolic waves have been studied in CP in short-axis or in parasternal long-axis view using color Doppler myocardial imaging. Polyphasic tissue waves are common during early diastole. Diastolic velocities > 9 cm/sec are highly specific for CP. (Fig. 18.51).39
• Majority of patients with CP have some degree of pulmonary regurgitation (PR). CW Doppler spectrum of PR has been studied in a variety of conditions. In CP, the duration of PR Doppler signal varies with respiration pan-diastolic during expiration and only
early and mid-diastolic during inspiration due to increased RV end-diastolic pressure (Fig. 18.52). ttis sign has about 70% sensitivity and specificity.
• Torsion and rotational characteristics of the LV have been studied in CP and found to be different compared to restrictive cardiomyopathy.
Constrictive pericarditis may have involvement of subepicardial muscle fibers either by fibrosis and calcification or tethering.40 ttis can result in hypo-rotation and reduced twist (Fig. 18.53).
In summary, echocardiographic diagnosis of CP needs a multiparametric approach because different echocardiographic signs have variable sensitivity and specificity.

Fig. 18.46: Augmented expiratory flow reversal in hepatic vein in a patient with constrictive pericarditis.

Fig. 18.47: Schematic diagram showing relationship between E/e' and LV filling pressure in heart failure versus constrictive pericarditis.

Fig. 18.48: Effusive-constrictive pericarditis in a young female. Note E/e' in early expiration is 6 while in first beat during inspiration, it is 4.5.

Fig. 18.49: Medial mitral versus lateral mitral e' in a normal subject. Lateral e' is higher due to greater free wall motion.

Fig. 18.50: Reduced lateral e' compared to medial e' in a patient with constrictive pericarditis (annulus reversus).

Fig. 18.51: Large Diastolic tissue velocity waves (arrow) seen in early diastole in constrictive pericarditis. The waves are much more prominent during early expiration.

Fig. 18.52: Temporal variation in pulmonary regurgitation (PR) continuous wave Doppler spectrum produced by phases of respiration in a patient with constrictive pericarditis.

Fig. 18.53: Surgically proven case of constrictive pericarditis. Note reduced basal and apical rotation with reduced twist of 6° only.
1. Spodick D. Pericardial Diseases. In: Braunwald E, Zipes D, Libby P, (Eds). Heart Disease: A Textbook of Cardiovascular Medicine. Philadelphia: WB Saunders; 2001. pp. 1823-76.
2. Imazio M, Trinchero R. The spectrum of inflammatory myopericardial diseases. Int J Cardiol. 2010;144(1):134.
3. Spodick DH. Myopericarditis/Perimyocarditis. In: The Pericardium: A comprehensive Textbook. Marcel Dekker, Inc.: New York; 2001. p.114.
4. Imazio M, Cecchi E, Demichelis B, et al. Myopericardi- tis versus viral or idiopathic acute pericarditis. Heart. 2008;94(4):498-501.
5. Parameswaran R, Goldberg H. Echocardiographic quantitation of pericardial effusion. Chest. 1983;83(5):767-70.
6. Vazquez de Prada J, Jiang L, Handschumacher M, et al. Quantification of pericardial effusions by three dimensional echocardiography. J Am Coll Cardiol. 1994;24:254-9.
7. D'Cruz IA, Hoffman PK. A new cross sectional echocardiographic method for estimating the volume of large pericardial effusions. Br Heart J. 1991;66(6):448-51.
8. Horowitz MS, Schultz CS, Stinson EB, et al. Sensitivity and specificity of echocardiographic diagnosis of pericardial effusion. Circulation. 1974;50(2):239-47.
9. Shabetai R. Changing concepts of cardiac tamponade. J Am Coll Cardiol. 1988;12(1):194-5.
10. Singh S, Wann LS, Schuchard GH, et al. Right ventricular and right atrial collapse in patients with cardiac tampon- ade-a combined echocardiographic and hemodynamic study. Circulation. 1984;70(6):966-71.
11. Armstrong WF, Schilt BF, Helper DJ, et al. Diastolic collapse of the right ventricle with cardiac tamponade: an echocar- diographic study. Circulation. 1982;65(7):1491-6.
12. Reydel B, Spodick DH. Frequency and significance of chamber collapses during cardiac tamponade. Am Heart J. 1990;119(5):1160-3.
13. Gillam LD, Guyer DE, Gibson TC, et al. Hydrodynamic compression of the right atrium: a new echocardiographic sign of cardiac tamponade. Circulation. 1983;68(2):294-301.
14. Torelli J, Marwick TH, Salcedo EE. Left atrial tamponade: diagnosis by transesophageal echocardiography. J Am Soc Echocardiogr. 1991;4(4):413-4.
15. Fusman B, Schwinger ME, Charney R, et al. Isolated collapse of left-sided heart chambers in cardiac tamponade: demonstration by two-dimensional echocardiography. Am Heart J. 1991;121(2 Pt 1):613-6.
16. Chuttani K, Pandian NG, Mohanty PK, et al. Left ventricular diastolic collapse. An echocardiographic sign of regional cardiac tamponade. Circulation. 1991;83(6):1999-2006.
17. Himelman RB, Kircher B, Rockey DC, et al. Inferior vena cava plethora with blunted respiratory response: a sensitive echocardiographic sign of cardiac tamponade. J Am Coll Cardiol. 1988;12(6):1470-7.
18. Fowler NO. the significance of echocardiographic-Doppler studies in cardiac tamponade. J Am Coll Cardiol. 1988;11(5): 1031-3.
19. Appleton CP, Hatle LK, Popp RL. Cardiac tamponade and pericardial effusion: respiratory variation in transvalvular flow velocities studied by Doppler echocardiography. J Am Coll Cardiol. 1988;11(5):1020-30.
20. Schutzman JJ, Obarski TP, Pearce GL, et al. Comparison of Doppler and two-dimensional echocardiography for assessment of pericardial effusion. Am J Cardiol. 1992; 70(15):1353-7.
21. Curtiss EI, Reddy PS, Uretsky BF, et al. Pulsus paradoxus: definition and relation to the severity of cardiac tamponade. Am Heart J. 1988;115(2):391-8.
22. Levine MJ, Lorell BH, Diver DJ, et al. Implications of echo- cardiographically assisted diagnosis of pericardial tamponade in contemporary medical patients: detection before hemodynamic embarrassment. J Am Coll Cardiol. 1991;17(1):59-65.
23. Ling LH, Oh JK, Schaff HV et al. Constrictive pericarditis in the modern era: evolving clinical spectrum and impact on outcome after pericardiectomy. Circulation. 1999;100(13): 1380-6.
24. Myers RB, Spodick DH. Constrictive pericarditis: clinical and pathophysiologic characteristics. Am Heart J. 1999;138(2 Pt 1):219-32.
25. Mehta A, Mehta M, Jain AC. Constrictive pericarditis. Clin Cardiol. 1999;22(5):334-44.
26. Hancock EW. Differential diagnosis of restrictive cardiomyopathy and constrictive pericarditis. Heart. 2001;86(3): 343-9.
27. Ling LH, Oh JK, Tei C, et al. Pericardial thickness measured with transesophageal echocardiography: feasibility and potential clinical usefulness. J Am Coll Cardiol. 1997; 29(6):1317-23.
28. Talreja DR, Edwards WD, Danielson GK, et al. Constrictive pericarditis in 26 patients with histologically normal pericardial thickness. Circulation. 2003;108(15):1852-7.
29. Rajagopalan N, Garcia MJ, Rodriguez L, et al. Comparison of new Doppler echocardiographic methods to differentiate constrictive pericardial heart disease and restrictive cardiomyopathy. Am J Cardiol. 2001;87(1):86-94.
30. Oh JK, Hatle LK, Seward JB, et al. Diagnostic role of Doppler echocardiography in constrictive pericarditis. J Am Coll Cardiol. 1994;23(1):154-62.
31. Hatle LK, Appleton CP, Popp RL. Differentiation of constrictive pericarditis and restrictive cardiomyopathy by Doppler echocardiography. Circulation. 1989;79(2):357-70.
32. Oh JK, Tajik AJ, Appleton CP, et al. Preload reduction to unmask the characteristic Doppler features of constrictive pericarditis. A new observation. Circulation. 1997; 95(4):796-9.
33. Sengupta PP, Mohan JC, Mehta V et al. Accuracy and pitfalls of early diastolic motion of the mitral annulus for diagnosing constrictive pericarditis by tissue Doppler imaging. Am J Cardiol. 2004;93(7):886-90.
34. Ha JW, Ommen SR, Tajik AJ, et al. Differentiation of constrictive pericarditis from restrictive cardiomyopathy using mitral annular velocity by tissue Doppler echocardiography. Am J Cardiol. 2004;94(3):316-9.
35. Garcia MJ, Rodriguez L, Ares M, et al. Differentiation of constrictive pericarditis from restrictive cardiomyopathy: assessment of left ventricular diastolic velocities in longitudinal axis by Doppler tissue imaging. J Am Coll Cardiol. 1996;27(1):108-14.
36. von Bibra H, Schober K, Jenni R, et al. Diagnosis of constrictive pericarditis by pulsed Doppler echocardiography of the hepatic vein. Am J Cardiol. 1989;63(7):483-8.
37. Ha JW, Oh JK, Ling LH, et al. Annulus paradoxus: transmitral flow velocity to mitral annular velocity ratio is inversely proportional to pulmonary capillary wedge pressure in patients with constrictive pericarditis. Circulation. 2001;104(9):976-8.
38. Reuss CS, Wilansky SM, Lester SJ, et al. Using mitral 'annulus reversus' to diagnose constrictive pericarditis. Eur J Echocardiogr. 2009;10(3):372-5.
39. Sengupta PP, Mohan JC, Mehta V et al. Doppler tissue imaging improves assessment of abnormal interventricular septal and posterior wall motion in constrictive pericarditis. J Am Soc Echocardiogr. 2005;18(3):226-30.
40. Sengupta PP, Krishnamoorthy VK, Abhayaratna WP, et al. Disparate patterns of left ventricular mechanics differentiate constrictive pericarditis from restrictive cardiomyopathy. JACC Cardiovasc Imaging. 2008;1(1):29-38.