
One of the commonest indications for the echocar- diographic examinations is ischemic heart disease (IHD) because of its prevalence, indication for function assessment, occurrence of heart failure, mitral regurgitation and the mechanical complications. The purpose of echocardiography in IHD is detection of ischemia, extent of ischemia and its consequences. Efforts to quantitate segmental wall-motion abnormality, area at risk of inducible ischemia, precise degree of stress-related hemodynamic alteration and quantitative change in pattern of regional contraction started along with the advent of the technique. Currently stress echocardiography (SE) is routinely used in detection of myocardial ischemia and viability. A 16- or 17-segment model of wall-motion scoring provides semiquantitation and has been extensively used and polar maps can be generated with the help of software.

MYOCARDIAL SEGMENT NOMENCLATURE AND CORONARY VASCULAR TERRITORY
Myocardium gets nutritive flow from the coronary arteries (Table 19.1). The nutritive flow sustains its systolic contractile and diastolic relaxation behavior. Coronary tree supplies specific segments (Fig. 19.1). Myocardial flow has a reserve, which is called upon to participate
in its activities during physiological stress. Anatomical obstruction reduces the flow reserve and produces ischemia that can be detected by echocardiographic examination.
For convenience, myocardium has been converted into a 17-segment model1,2 to supersede earlier 16-segment nomenclature (Fig. 19.2). Various views of 2D echocardiographic examination depict these segments (Figs 19.3 to 19.7).
RIGHT VENTRICULAR SEGMENTATION
The right ventricle is divided into three walls: anterior, lateral (also called right ventricular free wall) and posterior wall and shares the septal wall with the left ventricle (LV). Each wall is divided into a basal, mid and apical segment.3

Fig. 19.1: Diagram of the coronary arterial tree.
(RCA: Right coronary artery, PDA: Posterior descending artery, LAD: Left anterior descending artery, D1 and D2-diagonal arteries, Cx: Circumflex artery, OM1 and OM2: Obtuse marginal arteries).
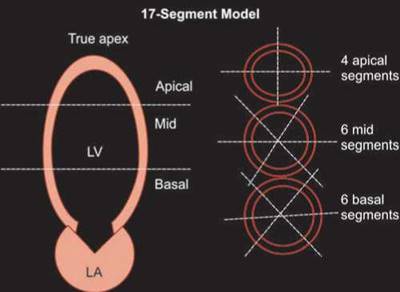
Fig. 19.2: Schematic depiction of the 17 segments of the myocardium. Entire myocardium is divided into 16 segments in apical and short-axis views. True apex as a cap represents 17th segment.

Fig. 19.3: Apical views to show 17-segment model. In long-axis view, only four segments are counted. 17th segment is the true apical cap.

Figs 19.4A and B: Biplane view showing six midwall segments in short axis and four basal and mid segments in long-axis view.
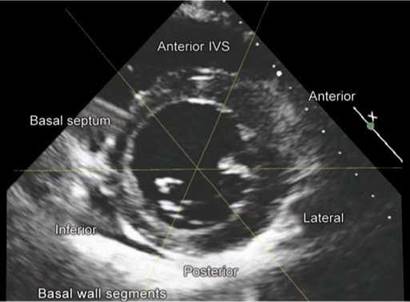
Fig. 19.5: Parasternal short-axis view at the level of mitral valve leaflets showing six basal segments with nomenclature.
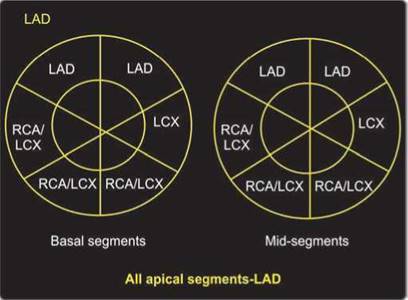
Fig. 19.6: Basal and mid left ventricle (LV) short-axis views showing the blood supply by the artery involved.
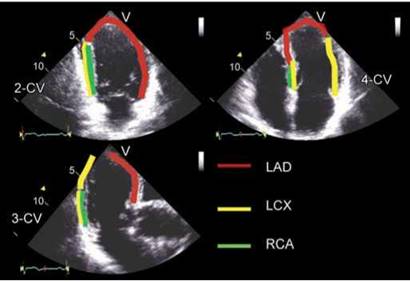
Fig. 19.7: Apical views showing coronary arteries supplying various segments.
the right coronary artery is the primary coronary supply to the right ventricle via acute marginal branches.
ISCHEMIA AND ECHOCARDIOGRAPHIC IMAGING
Transient or reversible ischemia can be detected by echocardiography. Most often, ischemia is due to reduced or absent flow or flow reserve due to anatomical obstruction as seen in coronary artery disease (CAD). Following is the cascade of ischemia (Fig. 19.8).
Two-dimensional (2D) echocardiography is widely used for the evaluation of regional left ventricular function because of its ability to depict endocardial excursion and wall thickening in real time.4 Normally, myocardial

Fig. 19.8: Ischemic cascade. Flow abnormality precedes wall-motion abnormality.

Fig. 19.9: Radial thickening behavior of an ischemic segment (red) compared to an ischemic segment (blue).
(IVC: Isovolumic contractions; ET: Ejection time; IVRT: Isovolumic relaxation time)
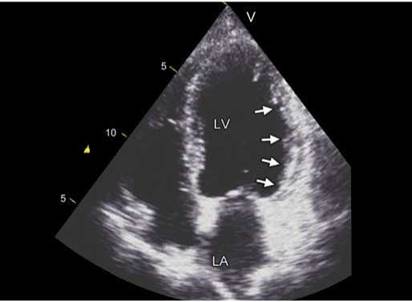
Fig. 19.10: Apical four-chamber view in systole. Lateral wall shows dyskinesis in basal and mid segments compared to apicolateral segment.

Fig. 19.11: Apical long-axis view showing diastolic thinning with reduced thickening of the mid anterior ventricular septum during systole (arrow). This is called hypokinesis.
segments show radial thickening and longitudinal and circumferential shortening during systole. Radial thickening is most readily appreciated and conventionally used to detect wall-motion abnormality.5,6 Following terms describe the thickening behavior of the normal myocardium:7
• Normokinesis—normal radial thickening compared to the adjacent segments
• Hyperkinesis—increased radial thickening compared to the other segments with local cavity obliteration
• The earliest change provoked by ischemia is delayed contraction, and the eye has insufficient temporal resolution to identify this in real-time, although the
ability to freeze and “step through” the image is a means of identifying changes that are not visible in real-time (Fig. 19.9).
One of the least contested observation during ischemia is systolic thinning called dyskinesis (Fig. 19.10). Reduction in systolic wall thickening is more often seen during ischemia (LV asynergy). This is labeled as:
- Hypokinesis-reduced wall thickening (Fig. 19.11).
- Akinesis-absent wall thickening (Fig. 19.12).
- Tardokinesis-delayed wall thickening.
- Dyskinesis-systolic wall thinning.
Wall motion abnormalities (asynergy) are best evaluated by comparison of the diastolic and systolic

Fig. 19.12: Long-axis view showing akinesis of the mid anterior septum.
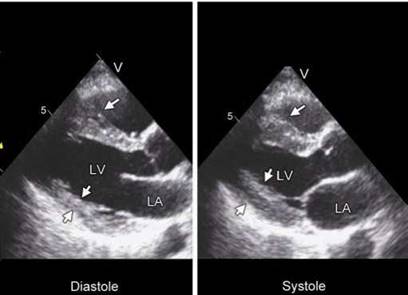
Fig. 19.13: Comparing basal and mid anterior septum and posterior wall thickness in diastole and systole. Normal thickening is noted in all the four segments.

Figs 19.14A and B: Increased systolic wall thickening of the inferior septum after revascularization of the right coronary artery.
images (Fig. 19.13). Wall motion is then labeled as normal, hypokinetic, akinetic, dyskinetic and aneurysmal in each of the 17 segments and scored 1-5 respectively.1,2
• If images of suitable quality are available, it is possible to analyze ventricular wall motion on a regional basis and to apply semiquantitative or quantitative descriptors to each segment of the myocardium. A number of simple and complex formats for performing such assessment have been proposed.
• Digitization of a single cardiac cycle and continuous loop replay (cine loops) is mandatory to assist the interpreter in detecting wall-motion abnormalities.
Wall-motion score can improve when areas of stunned myocardium regain contractility.8 Similar recovery can also occur after revascularisation of hibernating myocardium (Figs 19.14A and B). ttin, akinetic/dyskinetic and bright segments are strongly suggestive of myocardial scar due to old infarction (Fig. 19.15).
the average of the scores of all LV segments is referred to as wall motion score index (WMSI) and provides comparable prognostic information as LV ejection fraction.
The magnitude of LV asynergy caused by actual ischemia is related to the location of the culprit lesion

Fig. 19.15: Apical dyskinesis and increased echogenicity of the mid-septum (arrows).

Fig. 19.16: Use of contrast agent to define endocardium and wall motion.

Fig. 19.17: Apical four-chamber view showing normal radial thickening of the lateral wall but markedly reduced as well as paradoxical longitudinal strain (right panel, arrow).
in the ischemia-related artery, presence of collateral circulation and the extent of CAD.
• Apart from subjectivity of the visual assessment of LV asynergy, interpretation difficulties may also arise from both poor imaging technique and poor echogenicity. While the latter problem can be partially overcome by the use of contrast agents (Fig. 19.16), the first two can be addressed only by adequate training and experience of echocardiographers.
• Echocardiography can overestimate the amount of ischemic or infarcted myocardium, as wall motion of adjacent regions may be affected by tethering, disturbance of regional loading conditions and stunning.9 Therefore, wall thickening appears more precise than motion in order to evaluate the extent of regional systolic abnormalities.10
• Regional wall-motion abnormalities may occur in the absence of CAD, for example, in stress cardiomyopathy, myocarditis and so on.
• Ideally, the function of each segment should be confirmed in multiple views.
• In the ischemic cascade, impairment of longitudinal strain precedes impairment of wall thickening and motion.11 Hence, longitudinal function assessment is a better marker of regional function (Fig. 19.17).
• A semiautomated method of measuring regional longitudinal strain to develop segmental scores, classifying segments as normal, hypokinetic or akinetic is almost ready for prime-time use.12
There is a graded decrease in longitudinal peak systolic strain between normal, hypokinetic and akinetic segments (Fig. 19.18).
• It must be kept in mind that the heart moves through the interrogating plane as it cycles through diastole and systole. This gross movement, even in normal individuals causes different regions of the myocardium to be interrogated in systole and in diastole and may lead to spurious interpretive errors. 13
• Incorrect orientation of the short-axis plane such that the ventricle appears elliptical rather than circular will cause any motion of the posteroseptal and lateral walls to appear exaggerated.
• In patients with average image quality where only a portion of the endocardium is identified, one should not compare areas of endocardial movement to areas of movement where only the pericardium is visualized. This leads to the incorrect interpretation that asynergy is present in the poorly visualized segment.

Fig. 19.18: 2D longitudinal strain at rest and during stress in dominant left circumflex artery stenosis. Note longitudinal strain turning positive in basal and mid lateral segments as well as in inferior basal septum.

Fig. 19.19: Parasternal short-axis view showing increased diastolic thickness of the basal posterior and inferior segments with enhanced echogenicity.

Fig. 19.20: Apicoanterior myocardial infarction seven days after the onset. Note systolic asynergy (arrows) with apical hypertrabeculation.
П ECHOCARDIOGRAPHY IN IHD
Echocardiography is used for a variety of reasons in IHD. These are:
• Suspected acute coronary syndrome.
• Detection of ischemia in suspected IHD.
• Evaluation of myocardial infarction.
• Detection of mechanical complications of IHD.
• Stress echocardiography for detection of viability.
• Myocardial perfusion imaging with contrast.
• Tissue Doppler and strain imaging for prognosis.
• 3DE for LV volumes, function and sphericity, dys- synchrony.
EVALUATION OF MYOCARDIAL INFARCTION
New LV asynergy is the hallmark of acute coronary syndrome. In patients with acute chest pain of suspected ischemic origin, echocardiography is used to detect LV asynergy, which is of diagnostic significance in following situations:
• Patients with normal or nonspecific ECG changes.
• Preexisting left bundle branch block.
• Patients on pacemakers.
Most often, there is wall-motion abnormality defined by a specific coronary territory. Usually, there is akinesis or dyskinesis. However, occasionally, there is increased wall thickness and increased echogenic texture due to myocardial edema or hemorrhage (Fig. 19.19).
Apical myocardial infarction initially shows asynergy and subsequently quite often shows hypertrabeculation because of loss regional function (Fig. 19.20).
Echocardiography is routinely used during acute phase of myocardial infarction to assess the extent of wall- motion abnormalities, remodeling, presence of mitral regurgitation and grade of diastolic dysfunction.14
The involvement of RV or isolated RV infarction is easily detected by echocardiographic examination (Figs 19.21 and 19.22).
After healing of myocardial infarction, the segments involved become thin and scarred (enhanced echogenicity). These segments cause tethering of the adjacent segments (Figs 19.23 to 19.25).

Fig. 19.21: Apical four-chamber view showing dilated right atrium (RA) and right ventricle (RV) (left upper panel) with systolic thinning of the basal inferoposterior wall (right lower panel). Note systolic lengthening of the RV free wall by tissue Doppler (arrows).
(LV: Left ventricle; LA: Left atrium).

Fig. 19.22: Cardiogenic shock in a patient with isolated right ventricle (RV) infarction. Acute phase shows marked right atrium (RA) and RV dilatation with hinge point (left panel). Right panel shows RA and RV after recovery following angioplasty of the nondominant right coronary artery.

Fig. 19.23: Parasternal long-axis view showing diastolic thinning of the posterior wall.
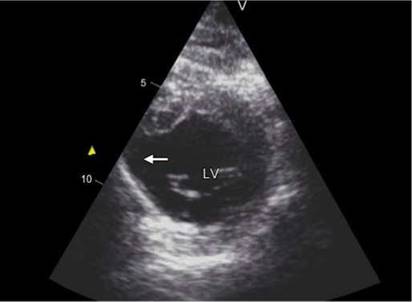
Fig. 19.24: Scarred basal inferior segment with dyskinesis.
MECHANICAL COMPLICATIONS OF MYOCARDIAL INFARCTION
Echocardiography can be of great assistance in the evaluation of a patient who, either in the immediate postinfarction period or later during recovery, develops complications.
the most common complication is Dressler's synd rome, a pericarditis typically occurring a few weeks after
myocardial infarction.15 Echocardiography is valuable for detecting the presence of an effusion and for showing that any apparent increase in heart size is due to this and not to the development of a ventricular aneurysm.
With a large effusion and impaired ventricular filling, cardiac tamponade may develop. the provisional diagnosis is usually made from the clinical signs, but rapid echocardiographic confirmation of a large effusion in the presence of tamponade physiology indicates the need for pericardiocentesis.

Fig. 19.25: Color kinesis in apical four-chamber view showing apical akinesis.
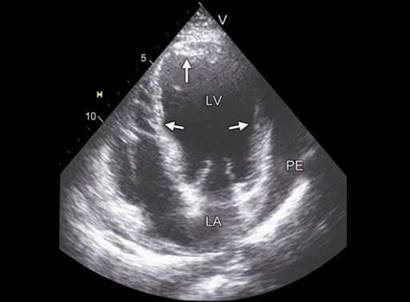
Fig. 19.26: Pericardial effusion (PE) following anterior myocardial infarction (arrows.)
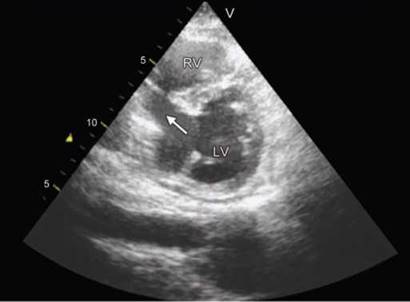
Fig. 19.27: Rupture of the posterior ventricular septum causing ventricular septal defect (arrow) following inferior myocardial infarction.

Fig. 19.28: Modified apical four-chamber view showing ventricular septal defect (arrow) due to distal septal rupture.
Post infarction ventricular septal defect (VSD) most commonly occurs at the junction of the anterior and posterior portions of the septum,1617 usually near the apex (Figs 19.27 to 19.29).
It is frequently difficult to visualize on any single view. While visualization of the actual defect may be difficult, it may strongly be suspected by a severe wall motion abnormality in the distal septum. With color Doppler echocardiography and 3DE, the presence of a postinfarction VSD may be confirmed with certainty.
Intramyocardial hematoma or localized hemorrhagic area detected by echocardiography is a subacute, partial rupture of the myocardium.18,19 ttese hematomas usually occur after myocardial infarction, chest trauma, surgery or percutaneous coronary intervention, but they can also develop spontaneously. Standard transthoracic echocardiography usually shows an echo-free or hypoechoic intramyocardial neocavity (Figs 19.30 to 19.32).
Hemorrhagic myocardial infarction was rarely seen in autopsy studies in the prereperfusion era, but its reported

Fig. 19.29: Mid muscular ventricular septal defect (arrow).

Fig. 19.30: Intramural hematoma (arrow) just after the percutaneous stent implantation in left anterior descending artery following acute anterior myocardial infarction.
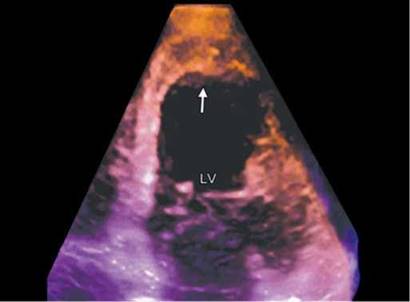
Fig. 19.31: 3DE showing apical hematoma (arrow).

Fig. 19.32: Dissecting myocardial hematoma in apical myocardium after delayed angioplasty (arrows).
incidence markedly increased after the introduction of thrombolytic therapy. Recent studies showed that it occurs frequently after primary percutaneous coronary intervention and is related to worse remodeling, falling ejection fraction and larger volumes.
Echocardiographic detection of intramyocardial hemorrhage is subtle and needs careful evaluation of zoomed out pictures of the affected segments. Apical involvement is more frequent but it occurs at other places as well. Some patients have been seen to develop sudden cardiac rupture.
There is a clear difference with pseudoaneurysm as this latter is a total rupture of the myocardial wall contained by
the pericardium, whereas the dissecting intramyocardial hematoma is a bloody cavity delimited externally by part of myocardium and pericardium. Anatomorphologic examination reveals a bloody cavity externally delimited by myocardium and pericardium and internally by the myocardium remaining and endocardium.
Myocardial Dissection Without Hematoma
Occasionally, myocardial dissection occurs with flap falling into the cavity like in aortic dissection with no blood collection between layers (Figs 19.33 to 19.38). This may be associated with true or false aneurysm.

Fig. 19.33: Apical myocardial dissection with hematoma (arrows).

Fig. 19.34: Localized pericardial effusion adjacent to intramural hematoma in the basal posterior wall with dyskinesis of the mid posterior segment.

Fig. 19.35: Myocardial dissection without definite echolucent delimiting cavity.

Fig. 19.36: Dissecting flap fluttering in the left ventricle (LV) cavity (arrow) in a patient with large anterior myocardial infarction.
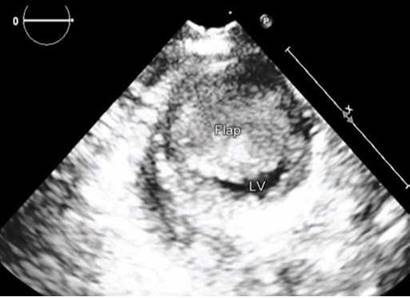
Fig. 19.37: Parasternal short-axis view with myocardial flap obliterating the cavity.
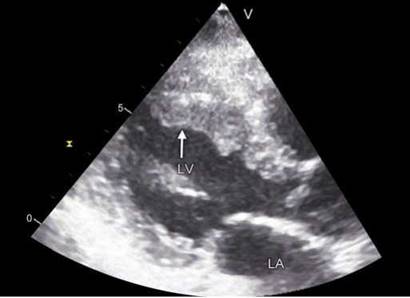
Fig. 19.38: Parasternal long-axis view showing dissection of the anterior interventricular septum (arrow) in an old lady.
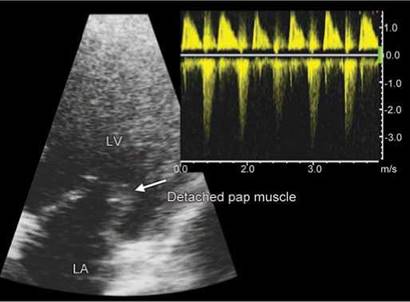
Fig. 19.39: Papillary muscle rupture with head attached to the posterior leaflet (arrow). Right upper panel shows triangular jet of mitral regurgitation with low velocities indicating presence of shock.

Fig. 19.40: Biplane imaging showing multilobed apical thrombus (arrows).

Fig. 19.41: Longitudinally sliced left ventricular (LV) showing a large thrombus attached to the apicolateral segment (arrows).
As with postinfarction VSD, discovery of a new systolic murmur following infarction suggests rupture of a papillary muscle leading to mitral regurgitation. Echocardiography, in combination with Doppler methods, serves as the principal means for the detection and differentiation of these two entities.
Rupture of a papillary muscle head also provides a striking echocardiographic picture (Fig. 19.39). Flail chordae and the muscle head itself may be seen to be whirling around in the ventricle with the flail leaflet moving into the atrium in systole.20
Mural thrombi are almost invariably associated with an underlying wall-motion abnormality.21 Occasionally, chest wall reverberations make adequate interrogation of the left ventricular apex quite difficult, and the diagnosis of apical mural thrombus is best left to experienced observers.
Multilobulated presentation of a mural thrombus, particularly one with rapidly moving intracavitary components, has a higher incidence of peripheral embolization (Fig. 19.40).
While the sensitivity and specificity of the echocardio- graphic diagnosis of ventricular thrombus are not known precisely, there is a growing abundance of data that this approach is the most clinically reliable method currently available. trombus can be delineated better with contrast echocardiography and real-time 3DE (Fig. 19.41).
Left ventricular free wall rupture (LVFWR) is a dramatic complication of acute myocardial infarction (AMI) and is presumably responsible for as much as 20-30% of all infarct related deaths.22-24 Mechanical complications of AMI, including LVFWR, are becoming less frequent in day-to-day practice, at least in part due to our growing ability to deliver safe and effective reperfusion therapies (both pharmacological and mechanical) to a wide range of AMI patients.

Fig. 19.42: Left ventricle (LV) in short-axis view showing a tear in the free wall (arrow) with pericardial effusion (PE).

Fig. 19.43: Apical four-chamber view showing free wall rupture and pericardial effusion (PE).
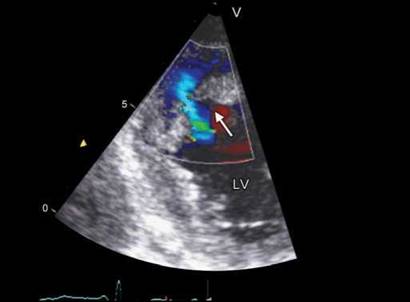
Fig. 19.44: Acute rupture of subendocardial muscle layer with blood seeping into the outer layer (arrow).
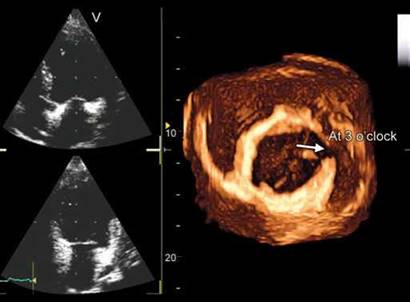
Fig. 19.45: 3DE slice showing communication with the pericardial space (arrow).
• When the acute form of LVFWR occurs, it usually results in an abrupt hemodynamic collapse with cardiac tamponade and electromechanical dissociation.
• Less frequently, in up to one-third of the cases, the rupture can be sealed by the epicardium or by a hematoma on the epicardial surface of the heart, forming a “LV diverticulum” or contained myocardial rupture (Figs 19.42 to 19.45).
• This situation represents a subacute pathologic condition standing somewhere between free rupture into the pericardial cavity and formation of a pseudoaneurysm.
Those with sub-acute rupture usually have canalicular or serpigenous communication, which can be better seen by 3DE by slicing the data set (Fig. 19.45).
True aneurysm formation is closely related to infarct expansion which is defined as acute dilation and thinning of the area of infarction that cannot be explained by additional myocardial necrosis.25 On echocardiography, true aneurysms appear as highly echogenic areas of thinned, scarred myocardium (Fig. 19.46). True aneurysms

Fig. 19.46: True apical aneurysm with wall thinning marked by arrows.
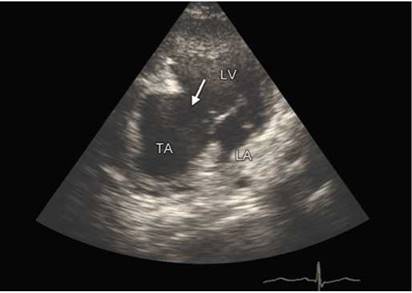
Fig. 19.47: True aneurysm of the inferoposterior wall.
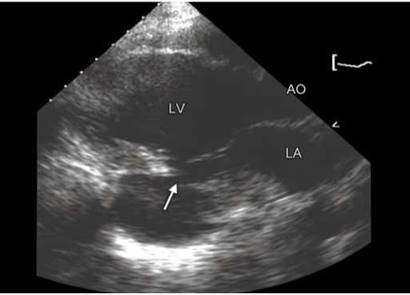
Fig. 19.48: Pseudoaneurysm of the left ventricle (LV) posterior wall (arrow). Note the narrow neck just below the mitral valve.

Fig. 19.49: Color Doppler interrogation of the narrow communication of pseudoaneurysm (PA).

Fig. 19.50: Massive pseudoaneurysm (arrows) adjacent to inferolateral wall of the left ventricle (LV) as a result of small lateral wall infarction. The communication is not visible in this view.
most commonly involve LV apex but can be seen anywhere in the LV (Fig. 19.47). Due to the stagnant blood flow, LV thrombi may frequently be seen within the aneurysms.
Pseudoaneurysms are contained ruptures with remodelling over time.25 the outer covering is of the pericardium (Figs 19.48 to 19.50). Some ruptures may occur over time rather than abruptly and then seal locally within the pericardium. A left ventricular pseudoaneurysm is thought to originate following this series of events. Such pseudoaneurysms are differentiated from true aneurysms by their very narrow neck and they may frequently contain clot.
Pseudoaneurysms may occur on any left ventricular wall segment involved with a severe transmural myocardial infarction. Table 19.2 differentiates true aneurysm from the pseudoaneurysm.
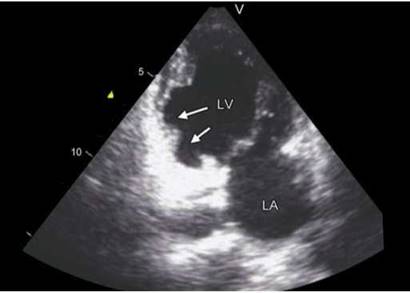
Fig. 19.51: Wide-neck pseudoaneurysm of the inferoposterior wall. Note thick walls of the margins.

Fig. 19.52: Spontaneous ischemia (angina at rest) showing dilatation of the cavity and systolic wall thinning compared to recovery image in systole on the right side.


Occasionally, pseudoaneurysms may have wide neck (Fig. 19.51).
In summary, echocardiography is useful for evaluation of LV function, risk stratification and assessment of prognosis after myocardial infarction (Table 19.3). At present, 2D echocardiography is frequently used in the management of patients with AMI. It is a low cost and safe imaging modality, which can be easily applied at bedside and is valuable for patient follow-up. Important benefit of echocardiography has been demonstrated in establishing the diagnosis, location and extent of myocardial infarction, and in detection of mechanical complications after myocardial infarction.
n stress echocardiography
Functional abnormalities secondary to diminished perfusion can cause segmental or global contractile or relaxation dysfunction and elevation of filling pressures which can be quantified. This premise forms the basis of quantitative SE.26
Basic purpose of SE is to assess:
• Contractile reserve.
• Perfusion reserve.
• Stroke volume reserve.
• Chamber compliance/stiffness.
Wall motion starts becoming apparent when the flow reserve falls either spontaneously or during stress (Fig. 19.52).
However, diameter stenosis by coronary angiography is an anatomical number and may not always have a good correlation with flow reserve which in turn may not correlate with wall-motion score. SE is performed in two ways (Figs 19.53 and 19.54):
1. Dynamic exercise combined with echocardiography.
2. Pharmacological stress (dobutamine-atropine, dipyridamole or adenosine).
Dobutamine stress echocardiography is performed in six stages: resting, 10 mic/kg/min, 20 mic/kg/min, 30 mic/ kg/minute, 40 mic/kg/minute and poststress. Each stage is of 3 minutes duration. At peak dose, atropine is used if target heart rate is not achieved.

Fig. 19.53: Parasternal long-axis views in systole for comparison at rest and immediately after exercise. There is decreased wall thickening of the anterior septum with some dilatation of the left ventricle cavity after exercise.

Fig. 19.54: Dobutamine-atropine stress echocardiography to compare the parasternal long-axis views. There is stress-induced hypokinesis of the anterior septum with left ventricle cavity dilatation.
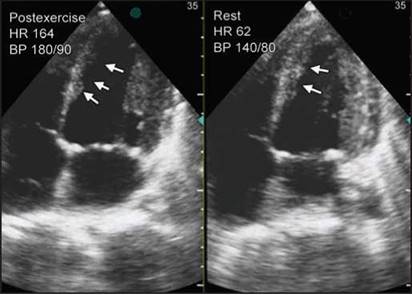
Fig. 19.55: Apical four-chamber view postexercise compared to the rest (right panel). There is decreased wall thickening of the mid and apical septum (arrows).
For the purpose of viability detection, small dose of dobutamine is used beginning at 2.5 mic/kg/minute and going upto 10 mic/kg/min.27
Echocardiographic analysis of regional left ventricular function is based upon the assessment of radial motion.26
State-of-the-art SE technique is use of quad screen and capturing only systolic images for simultaneous comparison as endless cine loops (Figs 19.55 to 19.57). Advantages of SE over other techniques:
• Inexpensive
• Radiation-free
• Portable
Disadvantages are:
• Highly operator-dependent.
• Dependent upon acquiring good images at peak stress.
• Semi-quantitative or qualitative.
• Stress echocardiography has nearly 80% sensitivity and specificity for detecting inducible ischemia.26
• Both dynamic exercise and pharmacological stress provide comparable data although dynamic exercise is more physiological.
• Images in dynamic stress are obtained immediately after the exercise and there may be some loss of information from the peak stress.
• During dobutamine stress, because of reduced preload and indifferent afterload, there is quite often reduced wall stress at rest and peak stress which may mask ischemia.
• End diastolic wall thickness at rest less than 6 mm is usually associated with nonviability.28 If the wall thickening is biphasic with initial improvement at low dose of dobutamine and worsening at high dose, this is highly suggestive of viability of the segment (s) concerned.27
• Long-axis motion is an important contributor to overall function, but has been difficult to evaluate clinically until the recent development of tissue Doppler and 2D strain techniques. Longitudinal strain in automated or semiautomated algorithm may be used to detect inducible ischemia.12

Fig. 19.56: Short-axis images in quad screen in various stages of stress.
• False normal interpretations of SE persist despite improved interpretive guidelines.
• Although some false negative results are a result of stenoses of borderline severity or submaximal stress, another important cause of false negative could be subtle wall-motion abnormality due to mild ischemia or hypertrophied walls or inadequate stress.26 Inducible myocardial ischemia is characterized by
simultaneous changes in systolic velocity, early diastolic and postsystolic velocity. Impaired augmentation of systolic, postsystolic and myocardial early diastolic velocity during dobutamine infusion can identify presence of underlying CAD (Figs 19.58 and 19.59). The postsystolic shortening appears to be a new sensitive marker of induced
ischemia compared with WMSI. All these parameters are being further explored before these become available for prime-time use.
Recent work suggests that longitudinal strain may provide a quantitative parameter to detect ischemia. A threshold value of > -5% and > -10% is indicative of akinesis and hypokinesis respectively (Fig. 19.59).
Strain and strain rate imaging may have its greatest utility in situations in which suboptimal stress limits the sensitivity of wall-motion analysis. There may be a physiologic basis for an enhanced sensitivity of strain imaging compared with wall-motion analysis in patients with suboptimal stress because of early involvement of longitudinal fibers in ischemic process.

Fig. 19.57: Quad screen format for analysis of segmental wall motion in parasternal long-axis views.

Fig. 19.58: Peak systolic myocardial velocities at rest (2.5-6 cm/sec from apex to base) show a 2 to 3 fold increase during dobutamine infusion (right panel).

Fig. 19.59: Change in 2D longitudinal strain in all the six segments in apical four-chamber view during stress (dobutamine infusion). Only basal and mid lateral segments show change above a threshold. Overall 2D longitudinal strain of six segments changes from -11.7% to -9.2% (20% change).
references
1. Manuel D Cerqueira, Neil J Weissman, Vasken Dilsizian, et al. Standardized myocardial segmentation and nomenclature for tomographic imaging of the heart. A statement for healthcare professionals from the Cardiac Imaging Committee of the Council on Clinical Cardiology of the American Heart Association. Circulation. 2002:105;539-42.
2. Lang RM, Bierig M, Devereux RB, et al. Recommendations for chamber quantification. Eur J Echocardiogr. 2006;7(2):79-108.
3. Rudski LG, Lai WW, Afilalo J, et al. Guidelines for the echo- cardiographic assessment of the right heart in adults: a report from the American Society of Echocardiography endorsed by the European Association of Echocardiography, a registered branch of the European Society of Cardiology, and the Canadian Society of Echocardiography. J Am Soc Echocardiogr. 2010;23(7):685-713.
4. Kerber RE, Marcus ML, Ehrhardt J, et al. Correlation between echocardiographically demonstrated segmental dyskinesis and regional myocardial perfusion. Circulation. 1975;52(6):1097-1104.
5. Lieberman AN, Weiss JL, Jugdutt BI, et al. Two-dimensional echocardiography and infarct size: relationship of regional wall motion and thickening to the extent of myocardial infarction in the dog. Circulation. 1981;63(4):739-46.
6. Pandian NG, Skorton DJ, Collins SM, et al. Myocardial infarct size threshold for two-dimensional echocardiographic detection: sensitivity of systolic wall thickening and endocardial motion abnormalities in small versus large infarcts. Am J Cardiol. 1985;55(5):551-5.
7. Weiss JL, Bulkley BH, Hutchins GM, et al. Two-dimensional echocardiographic recognition of myocardial injury in man: comparison with postmortem studies. Circulation. 1981;63(2):401-408.
8. Miller TD, Weissler AM, Christian TF, et al. Quantitative measures of regional asynergy add independent prognostic information to left ventricular ejection fraction in patients with prior myocardial infarction. Am Heart J. 1997;133(6):640-7.
9. Blondheim DS, Beeri R, Feinberg MS, et al. Reliability of visual assessment of global and segmental left ventricular function: a multicenter study by the Israeli Echocardiography Research Group. J Am Soc Echocardiogr. 2010;23(3): 258-64.
10. Moynihan PF, Parisi AF, Feldman CL. Quantitative detection of regional left ventricular contraction abnormalities by two-dimensional echocardiography. I. Analysis of methods. Circulation. 1981;63(4):752-60.
11. Liel Cohen N. A new tool for automated assessment of segmental wall motion, based on longitudinal 2D strain: a multicenter study by the Israeli Echocardiography Research Group. Circ Cardiovasc Imaging. 2010;3:47-53
12. Yip G, Khandheria B, Belohlavek M, et al. Strain echocardiography tracks dobutamine-induced decrease in regional myocardial perfusion in nonocclusive coronary stenosis. J Am Coll Cardiol. 2004;44(8):1664-71.
13. Picano E, Lattanzi F, Orlandini A, et al. Stress echocardiography and the human factor: the importance of being expert. J Am Coll Cardiol. 1991;17(3):666-9.
14. Neskovic AN, Bolognese L, Picard MH. Echocardiography in acute myocardial infarction. Neskovic AN, Flachskampf FA, Picard MH (Eds) Emergency Echocardiography. 2005; 129-46.
15. Neskovic AN, Picard MH. Echocardiography in complications of acute myocardial infarction. Neskovic AN, Flach- skampf FA, Picard MH (Eds) Emergency Echocardiography. 2005; 147-64.
16. Crenshaw BS, Granger CB, Birnbaum Y, et al. Risk factors, angiographic patterns, andoutcomes in patients with ventricular septal defect complicating acute myocardial infarction. GUSTO-I (Global Utilization of Streptokinase and TPA for Occluded Coronary Arteries) Trial Investigators. Circulation. 2000;101(1):27-32.
17. Moore CA, Nygaard TW, Kaiser DL, et al. Postinfarction ventricular septal rupture: the importance of location of infarction and right ventricular function in determining survival. Circulation. 1986;74(1):45-55.
18. Vargas-Barron J, Romero-Cardenas A, Roldan FJ, et al. Long-term follow-up of intramyocardial dissecting hematomas complicating acute myocardial infarction. J Am Soc Echocardiogr. 2005;18(12):1422.
19. Jahnke C, Hetzer R, Komoda T, et al. Images in cardiovascular medicine. Intramural dissecting hemorrhage of the myocardium. Circulation. 2007;115(19):e457-9.
20. Nishimura RA, Schaff HV Shub C, et al. Papillary muscle rupture complicating acute myocardial infarction: analysis of 17 patients. Am J Cardiol. 1983;51(3):373-7.
21. Visser CA, Kan G, Meltzer RS, et al. Embolic potential of left ventricular thrombus after myocardial infarction: a two-dimensional echocardiographic study of 119 patients. J Am Coll Cardiol. 1985;5(6):1276-80.
22. Lopez-Sendon J, Gonzalez A, Lopez de Sa E, et al. Diagnosis of subacute ventricular wall rupture after acute myocardial infarction: sensitivity and specificity of clinical, hemodynamic and echocardiographic criteria. J Am Coll Cardiol. 1992;19(6):1145-53.
23. Moreno R, Lopez de Sa E, Lopez-Sendon JL, et al. Frequency of left ventricular free-wall rupture in patients with acute myocardial infarction treated with primary angioplasty. Am J Cardiol. 2000;85(6):757-60, A8.
24. Yip HK, Wu CJ, Chang HW, et al. Cardiac rupture complicating acute myocardial infarction in the direct percutaneous coronary intervention reperfusion era. Chest. 2003;124(2):565-71.
25. Schattenberg TT, Giuliani ER, Campion BC, et al. Postinfarction ventricular aneurysm. Mayo Clin Proc. 1970;45(1): 13-19.
26. Cullen MW, Pellikka PA. Recent advances in stress echocardiography. Curr Opin Cardiol. 2011;26(5):379-84.
27. Allman KC. Noninvasive assessment myocardial viability: current status and future directions. J Nucl Cardiol. 2013;20(4):618-37; quiz 638.
28. Cwajg JM, Cwajg E, Nagueh SF, et al. End-diastolic wall thickness as a predictor of recovery of function in myocardial hibernation: relation to rest-redistribution T1-201 tomography and dobutamine stress echocardiography. J Am Coll Cardiol. 2000;35(5):1152-61.