Regurgitation
INTRODUCTION
Aortic regurgitation (AR) is characterized by regurgitation of blood from the aorta to the left ventricle (LV) during diastole and is attributable to diverse congenital and acquired abnormalities of the aortic valve or the wall of the aortic root. Pure AR (no element of aortic stenosis) has multiple causes, some of which directly affect the aortic valve (50% of all) and others of that are due to problems with the aorta without direct involvement of the aortic valve. Unlike aortic stenosis, which essentially is always a slowly progressing chronic condition, AR may develop acutely (acute AR) or over a prolonged period (chronic AR). Quantitation of AR, its mechanism of occurrence, associated hemodynamic load and need for intervention can be assessed by use of echocardiography.
HEMODYNAMICS OF AORTIC REGURGITATION
Diastolic reflux through the aortic valve is called AR. Aortic regurgitation leads to left ventricular (LV) volume overload. An increase in systolic stroke volume (SV) and low diastolic aortic pressure produce an increased pulse pressure. The LV becomes larger and more compliant, with greater capacity to deliver a large SV that can compensate for the regurgitant volume. The resulting hypertrophy is necessary to accommodate the increased wall tension that results from LV dilation.
The severity of AR is dependent on the diastolic valve area, the diastolic pressure gradient between the aorta and LV, and the duration of diastole (Figs 6.1 to 6.3).
During the early phases of chronic AR, the LV ejection fraction is normal or even increased (due to the increased preload and the Frank-Starling mechanism). As AR progresses, LV enlargement surpasses preload reserve on the Frank-Starling curve, with the ejection fraction falling to normal and then subnormal levels. The LV end-systolic volume rises and is a sensitive indicator of progressive myocardial dysfunction.1
Eventually, the LV attains its maximal diameter and compliance starts falling. Diastolic pressure begins to rise, resulting in symptoms. Increasing LV end-diastolic pressure may also lower coronary perfusion gradients, causing subendocardial myocardial ischemia. The LV gradually transforms from an elliptical to a spherical configuration.
Common causes of AR are:
• Congenital bicuspid or quadricuspid valve (Fig. 6.4)
• Sub arterial ventricular septal defect or aneurysm of sinus of Valsalva (Figs 6.5 and 6.6)
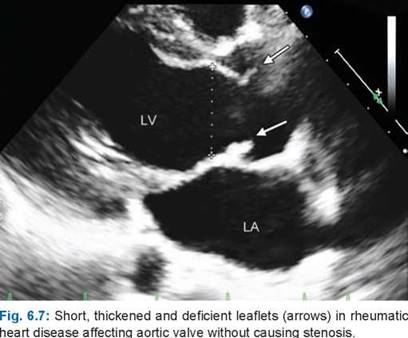
• Rheumatic heart disease (Fig. 6.7)
• Systemic hypertension
• Infective endocarditis (Fig. 6.8)
• Marfan syndrome (Fig. 6.9)
• Rheumatoid arthritis
• Ankylosing spondylitis
• Behcet's disease

Fig. 6.1 : In diastole, both mitral and aortic valves are open in aortic regurgitation, causing left ventricle volume overload.

Fig. 6.2 : Transaortic diastolic![]() is the driving force in aortic regurgitation.
is the driving force in aortic regurgitation.

Fig. 6.3 : Three-dimensional transthoracic echocardiographic view of the aortic valve with diastolic regurgitant area. Viewed from the left ventricle. (RVOT: Right ventricle outflow tract; RCC: Right coronary cusp, NCC: Noncoronary cups; LCC: Left coronary cups; RA: Right atrium; LV: Left atrium).

Fig. 6.4: Congenital bicuspid aortic valve in diastole showing regurgitant orifice.

Fig. 6.5 : Three-dimensional transthoracic echocardiographic showing ruptured aneurysm of sinus of Valsalva reducing support to the annulus and creating regurgitant orifice (red arrow).

Fig. 6.6 : Subannular pseudoaneurysm (red arrow) results in decreased support to aortic annulus causing aortic regurgitation.


• Ehlers-Danlos syndrome
• Whipple's disease
• Systemic lupus erythematosus
• Takayasu's disease
• Giant cell arteritis
• Aortic dissection (Fig. 6.10)
• Subaortic aneurysm
• Other causes of annuloaortic ectasia (Fig. 6.11)
Aortic root dilation may be present in up to 25% of
patients with AR due to bicuspid valve, hypertension or connective tissue disorders.2
FUNCTIONAL ANATOMY OF AORTIC REGURGITATION
There are three main mechanisms of AR.3,4
Type 1: Dilatation of the aortic root (Fig. 6.11)
Type 2: Excess cusp motion, including cusp prolapses and free edge fenestrations, with good cusp tissue quality (Fig. 6.12)
Type 3: Poor cusp tissue quality, including cusp retraction, extensive cusp calcifications (> Grade III) and/ or endocarditis (Fig. 6.13).


Cusp prolapse is further categorized into three groups.
1. Flail cusp (eversion of the cusp into the left ventricular outflow tract (LVOT); Fig. 6.12)
2. Partial or distal cusp prolapse (Fig. 6.14)
3. Whole cusp prolapse (Fig. 6.15).
Type 1 AR is identified when the dimensions of any components of the aortic root, including the aortic annulus, the sinuses of Valsalva and the sinotubular junction exceed the upper limits of published normal values.
Type 2 AR is considered in the presence of an eccentric AR jet and either a cusp prolapse or a cusp fenestration. Cusp prolapse is considered whenever the free edge of one or more the aortic cusps overrode the plane of the aortic annulus (Fig. 6.12).


Type 3 AR is considered whenever the quality or quantity of the cusp tissue is judged to be poor. Thickened and rigid valves with reduced motion, valves whose leaflet tissue have been destroyed by endocarditis and severely calcified valves are included in this category.
The degree of calcification of the aortic valve is scored as follows:
Grade I: no calcification Grade II: isolated small calcification spots Grade III: bigger calcification spots interfering with cusp motion
Grade IV: extensive calcifications of all cusps with restricted cusp motion
In addition to the anatomical evaluation of the aortic valve, the aortic root diameter (valve annulus, aortic sinuses, sinotubular junction and proximal ascending aorta) measurements are performed in mid-systole by inner edge-to-inner edge (Fig. 6.16).
DETECTION OF AORTIC REGURGITATION BY ECHO-POPPLER TECHNIQUES
Diastolic reflux through the aortic valve has direct and indirect clues (Fig. 6.17).
Three key areas require attention in echocardiographic examination.
• Structural details of the aortic valve and its apparatus
• Severity of AR as judged by the total volume of regurgitation
• Hemodynamic load of AR on the LV (LV size, function and geometry)
As structural details of the aortic valve are seen much better with two-dimensional (2D)/three-dimensional (3D) imaging, M-mode echocardiography is rarely used for assessment of AR.5,6 It is more of historical interest.
• M-mode echocardiography shows diastolic fluttering of the anterior mitral leaflet (AML), which is a finding of diagnostic significance. It results from the AR jet hitting the AML, and may be seen in cases of AR of even mild degree.
• In severe cases, the AML may fully close from the impact of the jet; this finding may serve as an indication for valve surgery. Premature mitral valve closure occurs more frequently in acute AR.
• Diastolic flutter of the interventricular septum may also be seen in some patients.
• Aortic root and LV dimensions can be increased by leading edge-to-leading edge method. In experienced hands, these measurements are valid.
• M-mode echocardiography may show systolic anterior motion of the anterior mitral valve leaflet or chordae.
Two-dimensional Echocardiography
The parasternal long-axis view is classically used to measure the LVOT, the aortic annulus and the aortic sinuses. Leaflet thickening and morphology can be visualized from this window as well as from the parasternal short- axis view and the apical five-chamber view. Sometimes, 2D transthoracic echocardiography may not allow correct identification of the anatomy and causes of AR. In this


situation, 3D echo could provide better delineation of the aortic valve morphology. In some cases, transesophageal echocardiography is needed particularly for assessing the mechanisms and causes of AR as well as the aortic root dimensions.
Several 2D echo findings can be observed in AR.
• If the regurgitant jet impinges on the anterior mitral valve leaflet, a reverse doming (concavity toward the ventricular septum) of the anterior leaflet can be observed on the parasternal long-axis view (Fig. 6.18). As a result, the leaflet presents a high-frequency
fluttering during diastole and its opening can be compromised (Fig. 6.19).
• the M-mode echo can confirm the fluttering motion of the anterior leaflet.
• It can also appear on the mitral valve chordae or the interventricular septum. Its absence cannot rule out the diagnosis of AR and a pseudofluttering can be observed in atrial fibrillation and in hyperkinetic circulatory states.
• the M-mode echo is also helpful in demonstrating the premature mitral valve closure as a sign of severe, usually acute, AR.
• Anatomical regurgitant orifice can be seen quite often in short-axis view (Fig. 6.20). the orifice provides direct clue to the severity. It is usually larger than the effective regurgitant area measured by the color Doppler flow convergence method. Aortic Regurgitation is usually severe if the planimetric area exceeds 0.5 cm2. However, it may vary in phases of diastole. Early diastolic area provides the largest size while the end-diastolic is the smallest.
• Presence of aortic valve vegetation, a flail aortic leaflet, aortic cusp retraction and shortening, or aortic root abnormalities are discernible with reasonable ease.
• Determination of LV dimensions and systolic function is central to the decision regarding the timing of surgery. In asymptomatic subjects, LV end-systolic internal dimension > 50 mm and/or ejection fraction < 0.55 are usual indications for surgery.


volumetric severity of aortic regurgitation
• The total forward volume across a regurgitant orifice is the sum of systemic SV and regurgitant volume.
• Hence, regurgitant volume can be obtained by calculating the difference between the total SV (regurgitant valve) and systemic SV (competent valve). R Vol = SV regurgitant valve - SV competent valve.
• In AR, the regurgitant volume corresponds to the difference between the LVOT SV (total) and the mitral inflow volume (competent valve, Fig. 6.21).

• In both, effective regurgitant area is calculated as R Vol divided by time-velocity integral (TVI) of the regurgitant jet velocity recorded by continuous wave (CW) Doppler (EROA = R Vol/TVI regurgitant jet).
• Regurgitant fraction is expressed as regurgitant flow divided by total flow.
• Regurgitant volume can be obtained by combined Doppler and 2D/3D volumetry of the LV.
• In presence of multivalvular regurgitation, it is not possible to use this simple formula.
color flow doppler evaluation of aortic regurgitation
• It is a semiquantitative method to assess AR.
• Parasternal long- and short-axis views are used because of better axial resolution.
• Color jet area and length do not correlate with severity of AR and should not be used.
• Central jets are found in rheumatic heart disease (Fig. 6.22), while eccentric jets occur in prolapse or perforation (Fig. 6.23).
• Height ofAR jet/ LVOT height can be used as a criterion for judging severity of AR.7 A ratio of > 0.65 indicates severe AR ( Fig. 6.24).
• Measuring jet height in LVOT is different from measuring vena contracta. Jet height is measured in divergence zone when jet is expanding. Jet expansion may be erratic in eccentric flow jets.

Fig. 6.24: Aortic regurgitation jet height is nearly two-thirds of the left ventricular outflow tract height, indicating severe aortic regurgitation.

Fig. 6.25: Arrows point to the vena contracta with convergence in aorta and divergence in the left ventricular outflow tract.

Fig. 6.26: Eccentric jet of severe aortic regurgitation (arrow) in a patient with bicuspid aortic valve.
aortic regurgitation assessment by vena contracta
For AR, imaging of the vena contracta—the regurgitant jet as it traverses the aortic orifice or the effective regurgitant area—is obtained from the parasternal long-axis view (Fig. 6.25).
• To properly identify the vena contracta, the three components of the regurgitant jet should be visualized (convergence zone, vena contracta and divergence zone).
• A narrow color sector scan coupled with the zoom mode is recommended to improve measurement accuracy.
• Vena contracta represents the smallest flow diameter at the level of the aortic valve in the LVOT, immediately below the flow convergence region (Fig. 6.25).
• It provides, thus, an estimate of the size of the effective regurgitant orifice area (EROA) and is smaller than the regurgitant jet width in the LVOT.8
• Using a Nyquist limit of 50 to 60 cm/s, a vena contracta width of < 3 mm correlates with mild AR, whereas a width of > 6 mm indicates severe AR.
• the measurement of the vena contracta is affected by several factors as the presence of multiple jets. In this situation, the respective widths of the vena contracta are not additive.
• the concept of vena contracta is based on the assumption that the regurgitant orifice is almost circular. the orifice is, however, often elliptical or irregular, which changes the width of the vena contracta in different views (Fig. 6.26).
• 3D color Doppler echo has been shown to be a useful tool in the visualization of the actual shape of the regurgitant orifice and could be used to measure the vena contracta.9 With 3D echo, an EROA of < 20 mm2 and an EROA of > 60 mm2 have been proposed to define mild AR and severe AR, respectively (Fig. 6.27).
proximal isovelocity surface area flow convergence method the assessment of the flow convergence zone is less often performed in AR than in mitral regurgitation.
• Imaging of the flow convergence zone is obtained from the apical three- or five-chamber or parasternal long- axis or upper right parasternal views (Fig. 6.28).


• the area of interest is zoomed, the sector size is reduced as narrow as possible to maximize frame rate and the Nyquist limit is adjusted to obtain a clearly visible, round and measurable proximal isovelocity surface area (PISA) radius.10
• the color flow velocity scale is shifted toward the direction of the jet. the PISA radius is measured from a stop frame as the distance between the regurgitant orifice and the first aliasing in early diastole (closest to the peak of regurgitant velocity).
• When imaged from the apical window, the PISA method significantly underestimates AR severity in the
presence of eccentric AR jets. In this situation, imaging the flow convergence zone from the parasternal long axis improves the accuracy of the PISA method.
• For central AR jets, the apical view remains the most appropriate.
• the PISA method has several limitations. First, it is not feasible in a significant percentage of patients with AR due to interposition of valve tissue and difficulty in correctly identifying the flow convergence zone.
• Nonplanar flow convergence zones that invalidate the hemispheric assumption are potential causes of either under- or over-estimation of AR severity by the PISA method (Fig. 6.29).
• Grading of the severity of AR classifies regurgitation as:10
Mild: EROA < 10 mm2 and regurgitant volume < 30 mL Moderate: EROA 10 to 29 mm2 and regurgitant volume 30 to 59 mL
this can be further subdivided into mild-to-moderate (EROA 10 to 19 mm2) and moderate-to-severe (EROA 20 to 29 mm2).
Severe: An EROA > 30 mm2 or a regurgitant volume of > 60 mL indicates severe AR.
diastolic flow reversal in the descending aorta and severity of aortic regurgitation
Aortic regurgitation can lead to diastolic flow reversal in the aorta (Figs 6.30 and 6.31), which can be assessed by several Doppler techniques.


• The flow reversal is best imaged in the upper descending aorta at the aortic isthmus level using a suprasternal view by using pulsed Doppler (Fig. 6.31).
• The sample volume is placed just distal to the origin of the left subclavian artery and it is aligned as much as possible along the major axis of the aorta.
• The Doppler filter is decreased to its lowest setting to allow detection of low velocities (< 10 cm/s).
• With milder degrees of regurgitation, there is a brief reversal of flow limited to early diastole. As the degree of the regurgitation increases, the duration and the velocity of the reversal flow increases.11
• It becomes sustained throughout diastole at velocities exceeding 20 cm/s in severe AR11 (Fig. 6.32).


• Significant holodiastolic reversal in the abdominal aorta is also a sensitive sign of severe AR (Fig. 6.33).
• However, in the case of reduced aortic compliance (advancing age) or in the presence of increased heart rate, the duration and velocity of flow reversal may be increased.
• In severe acute AR, diastolic velocity decreases quickly with no end-diastolic velocity due to equalization of aortic and LV diastolic pressures.
pressure half-time of aortic regurgitation signal
The rate of deceleration of the diastolic regurgitant jet and the derived pressure half-time reflect both the degree of regurgitation and the ventricular end-diastolic pressures.12


As the degree of AR increases, the aortic diastolic pressure decreases and the LV end-diastolic pressure increases (Figs 6.34A and B).
the late diastolic jet velocity is thus reduced and the pressure half-time shortened. A pressure half-time of < 200 ms is consistent with severe AR, whereas a value of > 500 ms suggests mild AR (Fig. 6.35).
• the pressure half-time is dependent upon chamber compliance in addition to chamber pressures.
• For a given severity of AR, pressure half-time may be further reduced by elevated LV diastolic pressures or prolonged in patients with increase in peripheral resistance or who have a dilated aorta with increased aortic compliance.
• It tends to normalize with chronic LV adaptation to AR. Hence, its sensitivity and specificity in detecting severe AR are modest.
• Accurate measurement of pressure half-time is also dependent on obtaining an adequate spectral envelope of the regurgitant jet.
• In acute severe AR, pressure half-time is markedly shortened, the CW spectrum of AR may become triangular and diastolic forward flow may be seen in end-diastole (Fig. 6.36).
m-mode color flow propagation velocity Although not commonly used, M-mode color flow propagation velocity > 80 cm/s has been suggested as a useful criterion to detect severe AR.13
summary of aortic regurgitation assessment by echo-doppler methods Minimum information that needs to be provided while reporting on a patient with AR is shown below.14-16
• Possible etiology should be mentioned after studying the valve anatomy and function.
• Severity or grade of AR should be mentioned by an integrated multiparametric approach using jet width, vena contracta, pressure half-time, flow reversal in thoracic aorta and PISA method whenever feasible.
• Eccentricity of jet and its origin should be recorded. Density of signal is not a useful criterion.
• Size of aortic root and ascending aorta should be reported.15
• Consequences of AR that need to be reported are LV dimensions and volumes, and ejection fraction. Global longitudinal strain is fast emerging as a useful prognostic factor.
• Right heart size, function and pulmonary pressures along with indexed left atrial volume should form part of the report.
• 3DE EORA may become a useful index once the technique is standardized.16
references
1. Weisenberg D, Omelchenko A, Shapira Y, et al. Mid-term echocardiographic progression of patients with moderate aortic regurgitation: implications for aortic valve surgery. J Heart Valve Dis. 2013;22(2):192-4.
2. Roman MJ, Devereux RB, Kramer-Fox R, et al. Twodimensional echocardiographic aortic root dimensions in normal children and adults. Am J Cardiol. 1989;64(8): 507-12.
3. El Khoury G, Glineur D, Rubay J, et al. Functional classification of aortic root/valve abnormalities and their correlation with etiologies and surgical procedures. Curr Opin Cardiol. 2005;20(2):115-21.
4. Le Polain de Waroux JB, Poleur AC, Goffinet C, et al. Functional anatomy of aortic regurgitation: accuracy, prediction of surgical reparability and outcome implications of transoesophageal echocardiography. Circulation. 2007;116 (suppl I): I-264-9.
5. European Association of Echocardiography recommendations for the assessment of valvular regurgitation. Part 1: aortic and pulmonary regurgitation (native valve disease) Lancellotti P et al on behalf of the European Association of Echocardiography European Journal of Echocardiography. 2010;11:223-44.
6. Lancellotti P, Tribouilloy C, Hagendorff A, et al. Scientific Document Committee of the European Association of Cardiovascular Imaging. Recommendations for the echo- cardiographic assessment of native valvular regurgitation:
an executive summary from the European Association of Cardiovascular Imaging. Eur Heart J Cardiovasc Imaging. 2013;14(7):611-44.
7. Perry GJ, Helmcke F, Nanda NC, et al. Evaluation of aortic insufficiency by Doppler color flow mapping. J Am Coll Cardiol. 1987;9(4):952-9.
8. Tribouilloy CM, Enriquez-Sarano M, et al. Assessment of severity of aortic regurgitation using the width of the vena contracta: A clinical color Doppler imaging study. Circulation. 2000;102(5):558-64.
9. Fang L, Hsiung MC, Miller AP, et al. Assessment of aortic regurgitation by live three-dimensional transthoracic echocardiographic measurements of vena contracta area: usefulness and validation. Echocardiography. 2005;22(9): 775-81.
10. Tribouilloy CM, Enriquez-Sarano M, Fett SL, et al. Application of the proximal flow convergence method to calculate the effective regurgitant orifice area in aortic regurgitation. J Am Coll Cardiol. 1998;32(4):1032-9.
11. Tribouilloy C, Avinee P, Shen WF, et al. End diastolic flow velocity just beneath the aortic isthmus assessed by pulsed Doppler echocardiography: a new predictor of the aortic regurgitant fraction. Br Heart J. 1991;65(1):37-40.
12. Samstad SO, Hegrenaes L, Skjaerpe et al. Half time of the diastolic aortoventricular pressure difference by continuous wave Doppler ultrasound: a measure of the severity of aortic regurgitation? Br Heart J. 1989;61(4):336-43.
13. Onbasili OA, Tekten T, Ceyhan C, Ercan E, Mutlu B. A new echocardiographic method for the assessment of the severity of aortic regurgitation: color M-mode flow propagation velocity. J Am Soc Echocardiogr. 2002;15(12):1453-60.
14. Zoghbi WA, Enriquez-Sarano M, Foster E, et al. American Society of Echocardiography. Recommendations for evaluation of the severity of native valvular regurgitation with two-dimensional and Doppler echocardiography. J Am Soc Echocardiogr. 2003;16(7):777-802.
15. Kang JW, Song HG, Yang DH, et al. Association between bicuspid aortic valve phenotype and patterns of valvular dysfunction and bicuspid aortopathy: comprehensive evaluation using MDCT and echocardiography. JACC Cardio- vasc Imaging. 2013;6(2):150-61.
16. Ewe SH, Delgado V van der Geest R, et al. Accuracy of three-dimensional versus two-dimensional echocardiography for quantification of aortic regurgitation and validation by three-dimensional three-directional velocity- encoded magnetic resonance imaging. Am J Cardiol. 2013;112(4):560-6.