
23
I. OVERVIEW
Lungs facilitate O2 and CO2 exchange between blood and air. O2 is required to help fuel adenosine triphosphate production by cells, whereas CO2 is formed as a byproduct of aerobic metabolism. Lungs facilitate their exchange by bringing blood into close proximity to atmospheric air at a blood–gas interface. When the diaphragm and other inspiratory muscles contract, the lungs inflate. Air flows into the lungs, replenishing O2 at the blood–gas interface and sustaining the steep O2 and CO2 pressure gradients required for optimal gas exchange. Exchange occurs rapidly, enhanced by the thin divide between blood and air (<1 μm) and by the large interface surface area. The efficiency of exchange is also critically dependent on the pulmonary circulation, which brings CO2 to the lungs for disposal and carries away O2 (Figure 23.1). Physiologic and pathologic changes in either ventilation or perfusion of the blood–gas interface can negatively impact lung performance.

Figure 23.1
Pulmonary and systemic circulations.
II. PARTIAL PRESSURES
Gases move between air and blood by passive diffusion. The basic principles governing gas diffusion are similar to those described for solute diffusion between two fluid-filled chambers (see 1·IV). However, the issue is complicated by a need to factor in how soluble a gas might be in blood (Figure 23.2). If a gas is water insoluble, it cannot enter the circulation except under extreme, nonphysiologic circumstances. In practice, this means that we discuss the forces driving O2 and CO2 diffusion between blood and air in terms of partial pressure gradients rather than concentration gradients.
A. Gas pressures
The random motion of gas molecules exerts pressure on the walls of the vessel that contains it. The amount of pressure is directly proportional to the number of molecules within the vessel, as described by the ideal gas law:

Where P = pressure, n = number of molecules, R = universal gas constant, T is temperature, and V is container volume.
B. Partial pressure
The term “partial pressure” recognizes that atmospheric air is a mix of several different gases. The total pressure exerted by gas mixtures is equal to the sum of partial pressures of each of the individual components (Dalton law).
1. Atmospheric air composition: Atmospheric air is composed of 78.09% N2, 20.95% O2, 0.93% argon (Ar), 0.03% CO2, and trace amounts of various other inert gases and pollutants. The fractional composition does not change with height above sea level or with temperature.
2. Inspired air composition: Air composition does change during inspiration because mucous membranes lining the nose and mouth add water vapor. By the time air reaches alveoli, it is saturated with 6.18% water. The fractional composition of the other gases is reduced correspondingly: 73.26% N2, 19.65% O2, 0.87% Ar, and 0.03% CO2.
3. Partial pressure of inspired air: Atmospheric pressure at sea level is 760 mm Hg, reflecting the mass of air molecules stacked above. The partial pressure of the individual gases that make up inspired air reflects their fractional composition. The partial pressure of O2 at the alveolar membrane (PAO2) is, thus, the product of atmospheric pressure (760 mm Hg) and fractional composition (19.7%):
PAO2 = 760 × 0.197 = 150 mm Hg
The partial pressure of CO2 (PACO2) is 0.21 mm Hg. The latter is negligible in physiologic terms and, therefore, is usually rounded down to 0 mm Hg (Table 23.1).
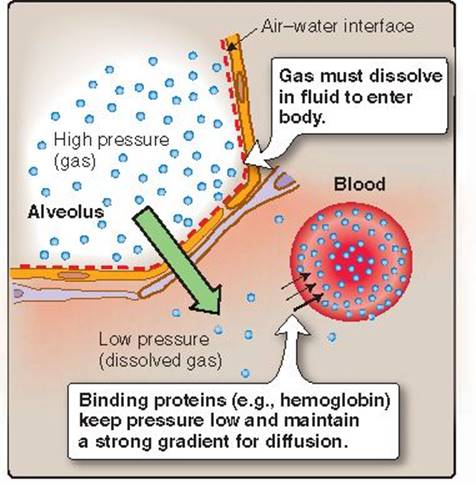
Figure 23.2
Gas diffusion between air and blood.
C. Blood gases
Alveolar ventilation brings atmospheric air to the blood–gas interface. The amount of O2 and other air constituents that dissolve in blood is proportional to their partial pressures and their solubility in blood (Henry law). O2 and CO2 are both soluble gases that rapidly equilibrate across the blood–gas interface during inspiration. PO2 in alveolar gas necessarily falls as O2 molecules cross the interface and dissolve in blood: When the two compartments have equilibrated, PAO2 has dropped from 150 mm Hg to 100 mm Hg. At equilibrium, the concentration of O2 dissolved in blood can be calculated from
[O2] = PAO2 × s = 100 mm Hg × 0.0013 mmol/L/mm Hg = 0.13 mmol/L
where [O2] is dissolved O2 concentration, and s is solubility of O2 in blood.
The Henry law thus predicts that if blood O2 concentration is 0.13 mmol and in equilibrium with a gas compartment, PO2 in that compartment must be 100 mm Hg. Therefore, we consider the partial pressure of O2 in blood to be 100 mm Hg, which allows us to discuss the pressure gradients driving gas movement between gas and liquid phases.

Partial pressures reflect the amount of free gas dissolved in fluid and do not provide information about how much additional gas might be bound to hemoglobin (Hb), for example.
III. PULMONARY CIRCULATION
The pulmonary circulation, like the systemic circulation, receives 100% of cardiac output, but there the similarities end. Several features make the pulmonary vasculature unique, reflecting its location within the general circulation and a number of adaptations designed to facilitate gas exchange.
A. Overview
The pulmonary circulation has a resistance of 2–3 mm Hg/L/min, or about fivefold less than the systemic circulation. Mean pulmonary arterial pressures are reduced correspondingly (10–17 mm Hg), as is supply-artery wall thickness. Pulmonary arterioles contain a fraction of the smooth muscle that characterizes systemic resistance vessels and makes them difficult to distinguish from veins. The paucity of muscle in the pulmonary vasculature means that the vessels readily distend in response to minor changes in filling pressure. The vasculature as a whole can accommodate up to 20% of circulating blood volume, and changes in posture routinely cause gravity-induced shifts of ~400 mL between the pulmonary and systemic circulations.
B. Blood–gas interface
Red blood cells (RBCs) are separated from atmospheric gas by the width of a capillary endothelial cell plus an alveolar epithelial cell (~0.15–0.30 μm). The density of pulmonary capillaries is so great that the alveolar surface is bathed in a near-continuous sheet of blood, which allows for highly efficient gas exchange. Pulmonary capillaries have an average length of 0.75 mm, providing ample opportunity for gas equilibration between blood and air, even at high flow rates. At rest, a single RBC traverses the length of a capillary and flows past two or three alveoli in ~0.75 s.
C. Lung volume
The high compliance of pulmonary blood vessels means that they readily collapse when compressed by surrounding tissues. In practice, this means that changes in airway pressure during the respiratory cycle have a major impact on alveolar perfusion rates. The nature and timing of the change depends on vessel location within the bronchial tree.
1. Supply vessels: Flow through pulmonary supply vessels (i.e., arteries and arterioles) is very sensitive to changes in intrapleural pressure (Ppl). Ppl becomes strongly negative during inspiration, reflecting contraction and downward movement of the diaphragm and outward movement of the chest wall. The negative pressure is transmitted to the lung parenchyma, causing alveolar inflation (Figure 23.3). The negative pressure also dilates blood vessels that are embedded in the lung parenchyma. Because vascular resistance is inversely proportional to vessel radius (R ∞ 1/r4), supply-vessel dilation during inspiration decreases pulmonary vascular resistance (PVR).

Figure 23.3
Effects of inspiration on pulmonary supply vessels. Ppl = pleural pressure; PVR = pulmonary vascular resistance;  = pulmonary blood flow;
  = alveolar ventilation.
2. Capillaries: Pulmonary capillaries course through the spaces between adjacent alveoli. When alveoli expand during inspiration, their walls stretch. The embedded capillaries are stretched longitudinally, causing their internal diameter to decrease (Figure 23.4). The same effect causes skin to blanch when stretched. Stretching capillaries increases their resistance to flow and increases PVR.
3. Pulmonary vascular resistance dependence on volume: The differential effects of inspiration on supply-vessel and capillary resistance summate to produce a U-shaped plot of PVR against lung volume (Figure 23.5). PVR is very high at low lung volumes (supply vessels are compressed) and at total lung capacity (capillaries are stretched), but resistance is lowest during normal quiet breathing.

Figure 23.4
Pulmonary capillary patency during inspiration.
D. Gravity
Because the pulmonary vasculature has a low resistance overall, pulmonary arterial pressures are also very low. This makes flow through the pulmonary vasculature extremely susceptible to gravitational influences.
1. Pulmonary blood pressures: The heart is located within the mediastinum, nestled between the right and left lungs (Figure 23.6). The pulmonary valve (where the pressure available to drive flow through the pulmonary circulation is measured) is located approximately 20 cm below the lung apex. The right ventricle generates a mean pulmonary arterial pressure (Ppa) of ~15 mm Hg, which approximates ~20 cm H2O. When an individual is in a prone position, arterial pressures at the lung apex and base should both approximate 20 cm H2O. When erect, gravity exerts a downward force that decreases arterial pressure above the heart by ~1 cm H2O for each cm of vertical distance. Gravity increases pressures below the heart by the same amount.
2. Regional differences: The effects of gravity on Ppa mean that when a person is upright, pulmonary flow is lowest at the apex and increases progressively with decreasing height (see Figure 23.6). We can distinguish three distinct zones (1 through 3) based on flow characteristics.
a. Zone 1—minimal flow: At the apex, alveolar pressure > arterial pressure > venous pressure. Because Ppa falls with height above the heart, pressure within an arteriole located ~20 cm above the ventricle is zero. Pulmonary venular pressure (Ppv) is less than zero at the same height (−9 cm H2O). This creates a 9–cm H2O pressure gradient available to drive flow through apical capillaries, but, in practice, they are collapsed. Collapse occurs because pressure within an alveolus (PA) at rest is also 0 cm H2O (i.e., barometric pressure), which is greater than the perfusion pressure maintaining capillary patency (see Figure 23.6, upper panel). Zone 1 only exists at the very pinnacle of the lung, when pulmonary vascular pressures are critically low (e.g., during hemorrhage or other form of circulatory shock) or when alveolar pressure is raised artificially by positive pressure ventilation.

Figure 23.5
Effects of lung volume on pulmonary vascular resistance. RV = residual volume; TLC = total lung capacity.
b. Zone 2—moderate flow: In zone 2, arterial pressure > alveolar pressure > venous pressure. Zone 2 includes the apex and the middle of the lung, regions in which Ppa and mean capillary pressure (Pc) are greater than PA. Ppv in zone 2 is still lower than PA, so the capillary tends to be compressed at the venular end, but flow continues. The resistance created by extravascular compression gradually decreases with lung height, reflecting the coincident rise in both Ppa and Ppv (note that PA is insensitive to position because it is determined by barometric pressure).
c. Zone 3—maximal flow: The lung base is located below the pulmonary valve. Gravity enhances perfusion pressures in this region, so arterial pressure > venous pressure > alveolar pressure. Vascular collapse is no longer an issue here. Instead, capillaries at the lung base are typically distended by high, gravity-enhanced perfusion pressures. In the systemic circulation, resistance vessels tightly control Pcthrough reflex constriction and dilation of smooth muscle layers that make up the vessel walls. Pulmonary arterioles contain so little smooth muscle that they are relatively ineffective pressure regulators. Thus, Pc rises in concert with Ppa and Ppv, and the capillary swells beyond normal capacity. Flow through blood vessels is proportional to the fourth power of internal radius, and, therefore, flow is disproportionately high also (see Figure 23.6, lower panel).
E. Flow regulation
Blood flow through systemic resistance vessels is controlled by the sympathetic nervous system, bloodborne agents, rising metabolite levels, and other factors. By contrast, pulmonary resistance vessels are relatively insensitive to sympathetic activity or humoral factors. The vasculature is mildly sensitive to rising interstitial CO2 and H+ levels, but whereas systemic resistance vessels would dilate reflexively, pulmonary vessels constrict when CO2 and H+levels rise. A predominant force controlling pulmonary resistance vessels and PVR is PAO2. Low O2 levels promote hypoxic vasoconstriction of pulmonary resistance vessels. This reflex is again the complete opposite of how systemic resistance vessels respond to hypoxia, but it has clear advantages for optimizing pulmonary function. Hypoxic vasoconstriction steers blood away from poorly ventilated areas, redirecting it to well-ventilated regions where gas exchange can occur.
F. Venous admixture
Ideally, blood would leave the pulmonary circulation and enter the systemic circulation at 100% saturation. In practice, this never occurs because there is always some degree of venous admixture, or the mixing of deoxygenated (venous) and oxygenated blood prior to blood entering the systemic arterial system. There are two main causes: shunts and low ventilation/perfusion (V˙A Q˙) ratios.

Figure 23.6
Regional perfusion and flow patterns in a static, upright lung. Values are given in cm H2O. PA = intraalveolar pressure;
Ppa = pulmonary arteriolar pressure;
Ppv = pulmonary venular pressure.
1. Shunts: Shunts allow venous blood to bypass the normal process of gas exchange. There are two types: anatomic shunts and physiologic shunts (Figure 23.7).
a. Anatomic: Anatomic shunts have a structural basis, comprising fistulas or blood vessels. Examples include an atrial septal defect that allows blood from the right atrium to enter the left atrium or an anastamosis between a pulmonary artery and a pulmonary vein. These are also known as right-to-left shunts.
b. Physiologic: Physiologic shunting occurs when atelectasis, pneumonia, or some other problem affecting ventilation of the blood–gas interface prevents gas exchange. Hypoxic vasoconstriction redirects flow, but there is always some residual perfusion of a nonfunctional interface. Blood from these regions escapes oxygenation and reduces arterial O2 saturation levels when it enters the systemic circulation.
2. Low ventilation/perfusion ratios: A ratios are discussed in more detail below, but if the blood–gas interface is perfused at rates that exceed its diffusional limits, O2 saturation cannot occur. Venous admixture is the result.
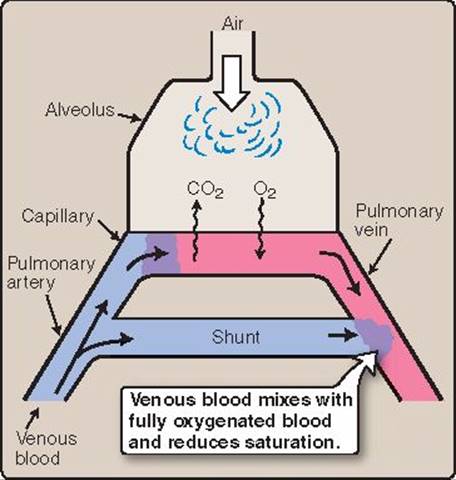
Figure 23.7
Shunts allow venous admixture.
IV. VENTILATION/PERFUSION RATIO
At rest, the pulmonary circulation is perfused with ~5 L/min of blood ( representing the entire output of the right heart. Lung inflation maximally draws ~4 L of air into the alveoli sacs during this time (alveolar ventilation is abbreviated as A), so the pulmonary A/ = 0.8. In an ideal lung, all alveoli would be ventilated and perfused optimally, but there are many physiologic causes of mismatch.
A. Model lung mechanics
The function of alveolar ventilation is to bring outside air into close proximity to blood so that O2 may be loaded and CO2 offloaded. Outside air contains 150 mm Hg O2 and negligible CO2 (Figure 23.8). Blood arriving at the alveolus from the pulmonary arterioles (mixed venous blood) is rich in CO2 (PCO2 = 45 mm Hg) but O2-poor (PO2 = 40 mm Hg). During normal quiet breathing, equilibration of both gases between air and blood completes before blood has progressed even a third of the way through the capillary, raising PACO2 to 40 mm Hg and lowering PAO2 to 100 mm Hg. Alveoli have no means of modifying these values further, so blood exiting a pulmonary capillary also contains 40 mm Hg CO2 and 100 mm Hg O2. Changes in either ventilation or perfusion will affect these values, however.
1. Airway obstruction: If an airway is obstructed by a mucus plug, for example, the A/ ratio drops to zero. In the absence of ventilation, alveolar gas equilibrates with mixed venous blood at a PACO2 of 45 mm Hg and a PAO2 of 40 mm Hg. Blood leaving the area of obstruction has no opportunity to exchange O2 or CO2 and, thus, remains unchanged during passage across the alveolar sac (Figure 23.9, left). This creates a physiologic shunt, as discussed above.

Figure 23.8
CO2 and O2 exchange between pulmonary blood and alveolar air. Partial pressures are given in mm Hg.

Figure 23.9
Effect of obstructing either ventilation or perfusion on PO2 and Pco2 in the lung. All partial pressures are given in mm Hg. VA = alveolar ventilation; Q = alveolar perfusion.
2. Blood flow obstruction: If blood flow is prevented by an embolus, for example, the A ratio approaches infinity. Alveolar gas composition remains unchanged following inspiration because there is no blood contact (see Figure 23.9, right).
B. Ventilation/perfusion ratios in an upright lung
Gravity significantly affects alveoli ventilation and perfusion (see Figure 23.6; also see Figure 22.14). This creates a broad spectrum of A ratios in an upright lung (Figure 23.10).
1. Zone 1—highest ratio: Alveoli at the lung apex ventilate poorly because they are inflated to 60% of maximal volume even at rest. Perfusion in this region is minimal because the vasculature is compressed by alveolar pressures that exceed perfusion pressures. Thus PO2 and PCO2 in the small volumes of blood exiting this region approaches that of inspired air (A/ ~ ∞).
2. Zone 2—moderate ratio: Ventilation improves slowly with decreasing lung height. Perfusion increases more steeply, however, causing the A/ ratio to fall rapidly toward the base.
3. Zone 3—lowest ratio: Alveoli at the lung base are compressed at rest and ventilate very well upon inspiration. Pulmonary perfusion pressures are also very high in this region, so flow rates are maximal.
4. Net effect: The extent to which the different regions contribute to the composition of the blood leaving the lung is determined by their perfusion rates. Thus, the A extremes seen at the apex have minimal effect on overall saturation levels. The O2 and CO2 content of systemic arterial blood is determined largely by the heavily perfused regions at the base.

Figure 23.10
Distribution of A ratios in an upright lung. A = alveolar perfusion.
Clinical Application 23.1: Tuberculosis
The microorganism that causes tuberculosis, Mycobacterium tuberculosis, favors lung regions where O2 levels are high and typically establishes itself at the apices, where alveolar gas composition most closely resembles that of atmospheric air. In advanced cases, lung tissue is destroyed, and large cavities develop. The cavities are avascular, which can make infection difficult to treat. Multiple drugs must be given together for a long period to fully eradicate tubercular organisms from the tissue.

Postmortem specimen showing apical lung lesions caused by tuberculosis.
C. Ventilation/perfusion mismatches
Blood flow through the lung base is so high that it exceeds the ventilatory capacity of the blood–gas interface and causes a local A mismatch. Blood leaving the area has a PO2 of around 88 mm Hg, or 12 mm Hg below optimum, whereas PCO2 is higher by ~2 mm Hg. Some degree of physiologic shunting caused by A mismatch occurs normally even in a healthy individual, but can become severe when an airway is obstructed by, for example, aspiration of a foreign body, tumor growth, or during an asthma exacerbation. The A ratio is an important measure of pulmonary function and health. Both parameters can be visualized clinically using radioactive tracers, but imaging techniques are generally used only if gross deficiencies in either ventilation or perfusion are suspected such as those by pulmonary embolism (Figure 23.11).
D. Alveolar–arterial oxygen difference
Potential problems with either ventilation or perfusion can also be assessed fairly simply from the alveolar–arterial difference for O2 (A–aDO2), which compares PO2 in alveoli with that of systemic arterial blood. Ideally the two values should be the same. In practice, there is always a 5–15 mm Hg PO2 difference between alveolar gas and blood, depending on age. PAO2 is assessed using a simplified form of the alveolar gas equation:
|
Equation 23.1 |
|
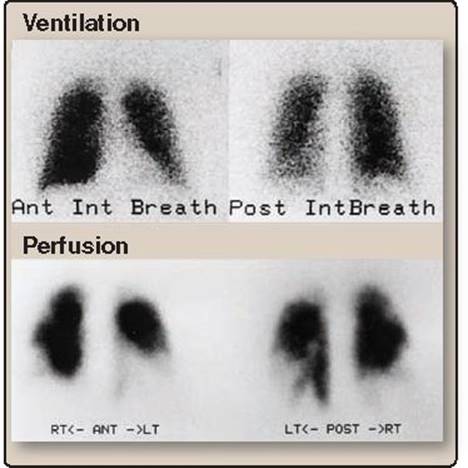
Figure 23.11
This ventilation scan (visualized radiographically using radioactive xenon gas) is normal, but the perfusion scan (visualized radiographically using radiolabeled albumin) shows many areas devoid of radioisotope, a pattern characteristic of pulmonary embolism.
Where PiO2 is the partial pressure of O2 in inspired air, PACO2 is alveolar PCO2, and R is the respiratory exchange ratio. PACO2 is determined by analyzing gas captured at the very end of expiration. “R” (normally 0.8) represents the ratio of CO2 produced: O2 consumed by internal respiration. PaO2 can be measured by arterial blood gas analysis. The difference between PAO2 and PaO2 for a healthy individual can be predicted as:
A-a gradient = 2.5 + 0.21 × age in years.
An A-a difference that is wider than predicted indicates that O2 uptake at the blood–gas interface is impaired (see Example 23.1).
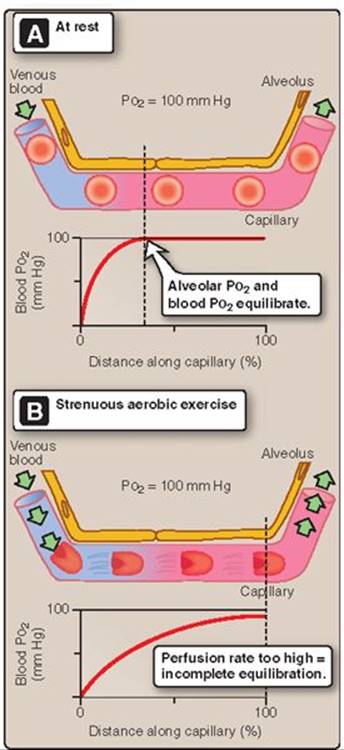
Figure 23.12
Effect of capillary perfusion rate on oxygenation saturation.
V. GAS EXCHANGE
The rate at which gases diffuse across the blood–gas interface (i.e., gas flow, or ) is determined by the pressure difference across the interface (ΔP), the surface area available for exchange (A), and barrier thickness (T):
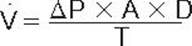
where D is a diffusion coefficient that takes into account the molecular weight and solubility of a gas. In practice, surface area, thickness, and the diffusion coefficient can be combined to yield a constant that describes the lung's diffusing capacity (DL) for gas. Gas flow across the barrier can then be estimated from:
= ΔP × DL
Lungs’ design maximizes flow by providing a large surface area for diffusion and by restricting barrier thickness to the width of a pneumocyte plus a capillary endothelial cell. Ventilation and perfusion maintain steep partial pressure gradients across the interface.
A. Diffusion-limited exchange
Blood traverses the length of a pulmonary capillary in ~0.75 s at rest. Equilibration of O2 between alveolar gas and blood occurs within a fraction of this time, so uptake is not normally limited by the rate at which O2 diffuses across the exchange barrier (Figure 23.12A). During maximal exercise, however, cardiac output increases, and capillary transit time decreases to <0.4 s. Blood may exit the capillary before being fully O2 saturated (see Figure 23.12B). O2 uptake is now considered to be diffusion limited because exchange has been limited by the rate at which O2 diffuses across the blood–gas interface. The effects of diffusion limitations can best be appreciated by studying the characteristics of carbon monoxide uptake, which is always diffusion limited (Figure 23.13).
The “CO” abbreviation is generally used to denote cardiac output in cardiovascular and other areas of physiology, but CO indicates carbon monoxide in pulmonary physiology.

Figure 23.13
Diffusion-limited gas exchange. PCO = partial pressure of carbon monoxide.
1. Carbon monoxide uptake: Hb binds CO with an affinity that is ~240 times greater than that for O2. In practice, this means CO molecules bind to Hb as fast as they can diffuse across the exchange barrier, and alveolar CO never has the chance to equilibrate with plasma CO. A diffusion limitation such as this might be offset by increasing the pressure gradient driving diffusion or by increasing the DL for CO (DLCO).
2. Changing perfusion rate: Intuitively, one would think that slowing blood flow through the capillary would be beneficial in terms of increasing net uptake. A slower flow rate would allow more time for the gas and liquid phases to come into equilibration before blood exits the capillary. Although decreasing perfusion rate does allow for greater saturation, net uptake actually decreases because the volume of blood exiting the capillary per unit time is reduced also.
Changing perfusion rate has no net effect on gas transport in a diffusion-limited exchange scenario.
Example 23.1
A 50-year-old woman with a history of prior deep vein thrombosis presents in the Emergency Department complaining of shortness of breath. A room air arterial blood gas (ABG) sample is obtained, and the patient is placed on supplemental O2.
Based on the results of the ABG, is the patient's A-a gradient normal or abnormal?
What is her likely diagnosis?
ABG results:
PaO2 = 70 mm Hg
PaCO2 = 32 mm Hg
pH = 7.47
PiO2 (room air, sea level) = 150 mm Hg
Based on age, the patient's A-a gradient would be predicted to be:
2.5 + (0.21 × 50) = 13 mm Hg
Using ABG values above and Equation 23.1:

Her observed A-a difference (PAO2 – PaO2) is 110 − 70 = 40 mm Hg, or 27 mm Hg higher than predicted.
The abnormally wide A-a gradient indicates that there is a A mismatch, suggesting an impairment of O2 uptake by the lungs.
These finding are consistent with pulmonary embolism.
3. Diffusion limitations: Emphysema and pulmonary fibrosis both limit O2 and CO2 diffusion by decreasing DL. Erosion of alveolar sacs reduces total barrier surface area in patients with emphysema. Pulmonary fibrosis increases barrier thickness and, thereby, increases the distance separating blood and alveolar air.
B. Perfusion-limited exchange
Blood becomes fully O2 saturated shortly after entering a pulmonary capillary (at rest). Because more O2 could be transferred if flow were increased (even though this transfer may be in excess of body requirements) exchange is considered to be perfusion limited. The characteristics of perfusion-limited gas exchange can be best appreciated by studying N2O uptake. Hb does not bind N2O, so blood and alveolar partial pressures for N2O equilibrate in <100 ms (Figure 23.14). Modest changes in barrier architecture have little effect on net uptake. Instead, net N2O uptake is tied to flow.
In a perfusion limited system, gas will saturate whatever amount of blood is presented to it over a wide range of values.
VI. OXYGEN TRANSPORT
O2 uptake from the atmosphere and carriage to the tissues is required to support internal respiration. O2 has a very poor water solubility compared with other gases, which limits the amount that can be transported in solution to ~3 mL of gaseous O2 per liter of blood. An average adult consumes ~250 mL O2/min at rest, so resting cardiac output would have to be maintained at 83 L/min and then climb to >1,000 L/min during exercise if transport relied on O2-solubility properties alone! Instead, blood's O2 transport ability is greatly enhanced by the presence of Hb, a protein uniquely designed to carry O2through the systemic vasculature and then release it to the tissues. It then helps transport CO2 back to the lungs for expiration.

Figure 23.14
Perfusion-limited gas exchange. PN2O = partial pressure of N2O.
A. Hemoglobin
Hb is a metalloprotein composed of four polypeptide chains (globins) as shown in Figure 23.15. HbA, the form found most commonly in adults, contains two alpha (α) chains and two beta (β) chains. Each globin is linked to a heme group that comprises a ferrous ion (Fe2+) held within a porphyrin ring. Iron allows deoxyhemoglobin to bind O2, forming oxyhemoglobin.
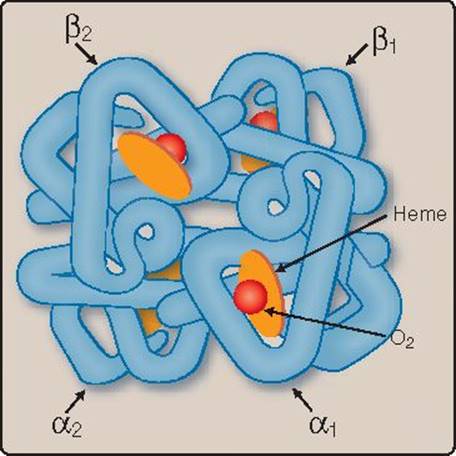
Figure 23.15
Hemoglobin structure showing location of the oxygen-binding heme group.
1. Structure: Hb comprises two dimeric subunits, each containing one α and one β chain. The chains within the subunits are stably linked by noncovalent bonds. The two subunits are linked weakly, however, and strength of association changes with O2-binding state.
2. Oxygen binding: The four heme moieties give Hb the ability to bind four O2 molecules. The interaction is reversible and is an oxygenation rather than oxidation. DeoxyHb has a relatively low affinity for O2, but each successive O2-binding event produces a conformational change within the protein that incrementally increases the affinity of the other sites (Figure 23.16). This binding cooperation yields a sigmoidal O2-dissociation curve, with the curve's steepest part coinciding with the range of PO2 values common to tissues (Figure 23.17). The curve approaches saturation at a PO2 of 60 mm Hg. Blood arterialization raises PO2 to 100 mm Hg but increases saturation level by only ~10%.
Hb changes color from dark blue to bright red when O2 binds, which makes it possible to monitor arterial O2-saturation levels using noninvasive pulse oximetry. A light-emitting probe is attached to a finger or ear, then the relative amounts of saturated and desaturated Hb is calculated from the amount of light absorbed at 660 nm and 940 nm, respectively.

Figure 23.16
Hemoglobin (Hb) binds oxygen (O2) with increasing affinity.
3. Hemoglobin concentration: The amount of O2 that blood can carry depends on Hb concentration.
a. Oxygen capacity: Blood contains ~150 g of Hb/L, or 15 g/dL (normal range is 12–16 g/dL for women and 13–18 g/dL for men). Each Hb molecule is capable of binding four O2 molecules, which is equivalent to 1.39 mL O2/g of Hb. Thus, blood's theoretical O2 capacity is 20.8 mL/dL, a value that increases and decreases in direct proportion to blood Hb concentration.
b. Oxygen saturation: O2 saturation is a measure of the number of occupied O2-binding sites on the Hb molecule. At 100% saturation (arterial blood), all four heme groups are occupied. At 75% saturation (venous blood), three are occupied. Only two sites are occupied at 50% saturation. The degree of O2 saturation is not dependent on Hb concentration, at least within a physiologic range.
B. Hemoglobin–oxygen dissociation curve
The dissociation curve's shape explains Hb's ability to bind O2 in the lung and then release it on demand to the tissues.
1. Association: Mixed-venous blood arrives at an alveolus with a PO2 of 40 mm Hg but an O2 saturation of ~75%. The cooperative nature of O2 binding to Hb means that the single unoccupied heme group has a very high affinity for O2. This allows the site to capture O2 as fast as it can diffuse across the blood–gas interface, simultaneously maintaining a steep pressure gradient for O2 diffusion across the exchange barrier even as equilibration with alveolar gas occurs. Note that the plateau region of the O2 dissociation curve begins at a PO2 of around 60 mm Hg (see Figure 23.17). In practice, this ensures that saturation still occurs if PAO2 is suboptimal (i.e., 60 mm Hg), either because ventilation is impaired or when cardiac output is increased to the point where perfusion becomes limiting.

Figure 23.17
O2 dissociation curve for hemoglobin (Hb).
2. Dissociation: Once blood arrives at a tissue, Hb must release bound O2 and make it available to mitochondria. Transfer is facilitated by the steepness of the pressure gradient between blood and mitochondria, which maintain a local PO2 of ~3 mm Hg. Hb begins releasing O2 at a PO2 of 60 mm Hg and delivers ~60% of total as PO2 falls to 20 mm Hg. Each O2 dissociation event lowers the affinity of the remaining heme groups for bound O2, so that if a tissue's metabolic rate is very high and its need for O2 is increased, unloading occurs with increased efficiency.
C. Dissociation curve shifts
Hb is uniquely sensitive to tissue needs, allowing it to deliver increasing amounts of O2 when metabolism increases. This is made possible through allosteric changes that decrease the protein's O2 affinity and promote unloading. These changes manifest as a rightward shift in the Hb–O2 dissociation curve (Figure 23.18).
1. Rightward shifts: Metabolism generates heat and CO2 and acidifies the local environment. All three changes reduce Hb's O2 affinity and cause it to unload O2. The liberated O2 keeps free (dissolved) O2levels high and maintains a steep pressure gradient between blood and mitochondria even as blood's O2 stores are being emptied.
a. Temperature: During strenuous exercise, muscle temperature rises by as much as 3°C. The Hb–O 2 dissociation curve shifts by ~5 mm Hg to the right as a result, causing more O2 to be released to the metabolically active tissue.

Figure 23.18
Decreasing the O2 affinity of hemoglobin (Hb) causes O2 unloading.
b. Carbon dioxide: Aerobic metabolism generates CO2 and causes tissue PCO2 to rise. CO2 binds to terminal globin amino groups and decreases Hb's O2 affinity. The Hb–O2 dissociation curve shifts to the right, and O2 is unloaded. CO2 also dissolves in water to yield free acid, which promotes further O2 unloading via the Bohr effect (see below).
c. Protonation: Protonation stabilizes the deoxy form of Hb and decreases its O2 affinity. Metabolism generates several different acids in addition to carbonic acid, and the amount produced is proportional to metabolic activity. The Hb–O2 dissociation curve shifts to the right, and O2 is released (the Bohr effect).
d. 2,3-Diphosphoglycerate: 2,3-Diphosphoglycerate (2,3-DPG) is synthesized from 1,3-DPG, which is an intermediate in the glycolytic pathway. 2,3-DPG is abundant in RBCs, its concentration rivaling that of Hb. 2,3-DPG binds preferentially to the deoxygenated form of Hb and stabilizes it, thereby reducing its O2 affinity (Figure 23.19). The Hb–O2 dissociation curve shifts to the right, and O2 is unloaded. 2,3-DPG and its effects on O2affinity is a constant in blood, unlike the effects of temperature, CO2, and H+, which typically remain localized to an active tissue.

Figure 23.19
2,3-Diphosphoglycerate (2,3-DPG) decreases hemoglobin's O2 affinity.
Chronic hypoxemia caused by pathologic changes in lung function or living at high altitude stimulates 2,3-DPG production. Increased 2,3-DPG levels shift the Hb–O2 dissociation curve even further to the right, which increases the tissue's accessibility to available O2 (see Figure 23.19). Although 2,3-DPG does reduce the efficiency of O2 loading by Hb in the lungs, the effects are minor and more than offset by the beneficial effects of assisting O2 delivery to tissues.
2. Leftward shifts: Hb's O2 affinity increases, and the Hb–O2 dissociation curve shifts left when body temperature decreases or when CO2, H+, or 2,3-DPG levels decrease. All of these changes reflect decreased metabolic activity and a decreased need for O2 delivery to tissues. A leftward shifted Hb–O2 dissociation curve is also observed in the fetus and as a result of CO binding to Hb.
a. Fetal hemoglobin: Fetal Hb (HbF) contains γ chains in place of the two β chains. This causes the fetal Hb–O2 dissociation curve to be shifted left compared with adult Hb.
i. Mechanism: HbF's increased O2 affinity compared with the adult form (HbA) reflects the fact that γ-globins bind 2,3-DPG very weakly. 2,3-DPG normally stabilizes the deoxygenated form of HbA and reduces its affinity. HbF's inability to bind 2,3-DPG favors O2 loading at low partial pressures.
If HbA is stripped of 2,3-DPG, its O2-dissociation curve resembles that of HbF. Storing blood causes 2,3-DPG concentrations to decline over the course of a week, causing a leftward shift in the dissociation curve (see Figure 23.19). Although RBCs replenish lost 2,3-DPG within hours to days of transfusion, giving a critically ill patient large volumes of 2,3-DPG–depleted blood presents some difficulties because such blood does not readily give up its O2.

Figure 23.20
Hereditary persistence of fetal hemoglobin (HbF). Red blood cells containing HbF appear bright pink.
ii. Benefits: O2 is delivered to a fetus via the placenta, which is an inefficient route for O2 transfer compared with lungs. Fetal PaO2 rarely exceeds 40 mm Hg as a result. The leftward shift in the Hb–O2dissociation curve brings it into closer alignment with PO2 values normally encountered in utero and allows fetal placental blood to achieve ~80% saturation, even though PaO2 is low. HbF is replaced by HbA in the months immediately following birth, although individuals with hereditary persistence of HbF may continue to express the fetal form well into adulthood (Figure 23.20).
b. Carbon monoxide: Hb binds CO with high affinity to produce carboxyhemoglobin, which is bright red in color. CO occupancy of the O2 binding sites severely reduces Hb's ability to bind and carry O2. Inhaling the gas at a concentration of only 0.1% reduces O2-carrying capacity by 500%. CO simultaneously stabilizes the high-affinity Hb form and shifts the Hb–O2 dissociation curve to the left (Figure 23.21). These changes dramatically reduce Hb's ability to release O2 to tissues and make CO an extremely deadly gas (Figure 23.22). CO poisoning is a leading cause of poisoning deaths in the United States.
CO is formed by combustion of hydrocarbons. Common sources of exposure include automobile exhaust, poorly ventilated heating systems, and smoke. Carboxyhemoglobin comprises up to ~3% of total Hb in nonsmokers, increasing to 10%–15% in smokers.
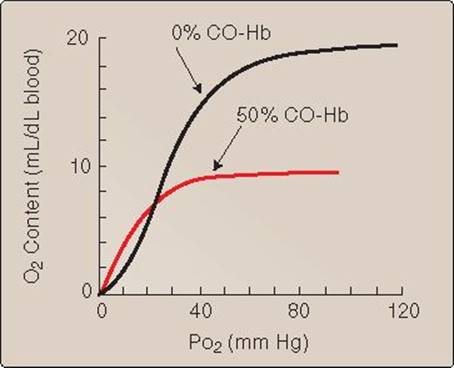
Figure 23.21
Carbon monoxide effects on hemoglobin O2 affinity. CO-Hb = carboxyhemoglobin.
VII. CARBON DIOXIDE TRANSPORT
Metabolism generates ~200 mL CO2/min in a normal person at rest. CO2 is carried away from tissues by venous blood and then exhaled from the lungs. The body's CO2 handling differs from the way it transports O2 in two important respects. First, CO2 is highly soluble in water and, therefore, does not require a carrier protein for transport through the circulation. Secondly, CO2 generates substantial amounts of acid when in solution, requiring the presence of a buffering system.

Figure 23.22
Carbon monoxide poisoning turns skin a bright cherry-red, a color that persists after death.
A. Carbon dioxide forms
CO2 is transported through the vasculature in three principal forms: in dissolved form, as HCO3−, and in association with Hb.
1. Dissolved: CO2 is >20 times more soluble in blood than O2, and substantial amounts are carried in this form (~5% of total transported CO2).
2. Bicarbonate: Ninety percent of CO2 is carried as HCO3−. HCO3− forms through the spontaneous dissociation of H2CO3 (see reaction below), through the actions of carbonic anhydrase (CA), and through combining carbonate and H+:
Equation 23.1

3. Carbamino compounds: Five percent of total blood CO2 is carried as carbamino compounds, which form by reversible reaction of CO2 with the amine groups of proteins, principally Hb. CO2 also binds to plasma proteins but not in significant amounts.
B. Carbon dioxide transport
Blood carries more than twice the amount of CO2 than O2 (~23 mmol/L CO2 versus 9.5 mmol/L O2). Much of this CO2 resides in stores, and passage through the systemic capillary beds increases its total content by only 8%. CO2that has been newly picked up from tissues is transported to the lungs principally as HCO3− (~60%) as shown in Figure 23.23. The remainder is carried in dissolved form (~10%) or in association with a protein (~30%). CO2uptake from the tissues occurs by simple diffusion, driven by the partial pressure gradient for CO2. Its subsequent fate can be divided into several discrete steps (Figure 23.24).
1. Uptake by red blood cells: RBCs contain high levels of CA-I that converts CO2 to H2CO3 as fast as it enters cells. This helps maintains a strong partial-pressure gradient between tissues and blood that drives CO2 diffusion. H2CO3 then rapidly dissociates to form HCO3− and H+ (see Equation 23.1).
2. Bicarbonate transport: HCO3− is transported out of the RBC by a Cl−-HCO3− exchanger. The Cl− shift causes a slight increase in RBC osmolarity and produces mild swelling, but this is reversed in the lungs.
3. Hydrogen-ion buffering: The H+ released during HCO3− formation remains trapped in RBCs by the cell membrane, which is relatively impermeable to cations. This might be expected to lower intracellular pH, but H+accumulation occurs at the precise moment that Hb is releasing O2 and undergoing a conformational change that favors H+ binding. As noted above (i.e., the Bohr effect), H+ binding actually facilitates O2 unloading by shifting the Hb–O2 dissociation curve to the right and reducing Hb's affinity for O2. Virtually all of the acid excess caused by loss of HCO3− to the plasma is buffered by Hb. With intracellular H+ kept low by Hb and the Cl−-HCO3− exchanger keeping HCO3− low, the reaction catalyzed by CA remains biased in favor of increased H+ and HCO3− formation. The CO2-carrying capacity of blood increases as a result.

Figure 23.23
Comparison of the ways in which O2 and CO2 are transported between lungs and tissues.

Figure 23.24
Transport of CO2 in blood. CA-I = carbonic anhydrase.
4. Carbamino formation: When Hb binds H+, it becomes a more favorable substrate for carbamino compound formation (the Haldane effect[Figure 23.25]). Hb carries appreciable amounts of CO2 in carbaminohemoglobin form.
C. Unloading
When blood arrives at the lungs, the partial pressure gradients for both O2 and CO2 reverse compared with tissues. A high PO2 causes H+ to dissociate from Hb (the Haldane effect) and the reaction in Equation 23.1 now favors H+and HCO3− association to form H2O and CO2. HCO3− reenters RBCs in exchange for Cl− and combines with H+ to form H2CO3, which dissociates to release CO2 and H2O. CO2then diffuses out of the blood, driven by the partial pressure gradient for CO2 between blood and the alveolar lumen.

Figure 23.25
Effect of PO2 on the CO2 dissociation curve (the Haldane effect). a = arterial blood; v = venous blood.
VIII. ACID–BASE CONSIDERATIONS
When CO2 dissolves in water, it forms carbonic acid. Although a relatively weak acid, it is produced in such prodigious quantities (>20 moles/day) that it could seriously interfere with normal tissue function if its levels were not closely monitored and regulated. In practice, the central nervous system (CNS) maintains plasma pH within an extremely tight range (pH 7.35–7.45), in part by adjusting ventilation to hold PaCO2 at around 40 mm Hg. However, the fact that CO2 can have such a profound influence on plasma pH also means that the CNS can modulate ventilation as a means of compensating for nonrespiratory disturbances in extracellular fluid pH balance.
A. CO2 effects on pH
CO2 dissolves in water (assisted by CA) to form carbonic acid, which quickly dissociates to yield protons and bicarbonate (Equation 23.1). The effect of this dissociation on plasma pH is given by the Henderson-Hasselbalchequation:

where pK+ is the dissociation constant for carbonic acid (6.1 at 37°C), and [HCO3−] and [CO2] denote concentrations of HCO3− and CO2, respectively. The concentration of CO2 in blood can be calculated from its solubility constant (0.03) and PCO2. Arterial blood has a PCO2 of 40 mm Hg and contains 24 mM HCO3−. Inserting these values into the Henderson-Hasselbalch equation:

Note that any increase in PCO2 will cause pH to fall (acidosis), whereas decreases will cause pH to rise (alkalosis).
B. Causes of changes in extracellular fluid pH
Changes in pH caused by the lungs are referred to as respiratory acidosis or respiratory alkalosis. Nonrespiratory changes are referred to as metabolic acidosis or metabolic alkalosis.
1. Respiratory acidosis: Increased PaCO2 results from hypoventilation, V
• mismatches, or an increase in the diffusional distance between the alveolar sac and pulmonary blood supply (due to pulmonary fibrosis or edema, for example).
2. Respiratory alkalosis: PaCO2 decreases with hyperventilation, typically because of anxiety or other emotional state. It can also result from hypoxemia precipitated by ascent to high altitude.
C. Compensation
Cells are defended against excess acid accumulation in the short term by buffers, most notably the HCO3− buffer system and intracellular proteins such as hemoglobin (see 3·IV·B). Buffers operate on a time scale of seconds or less. Correction of an altered acid−base status ultimately requires a change in lung or kidney function. CNS respiratory control centers continually monitor plasma pH (Figure 23.26). If pH falls, they increase pulmonary ventilation to transfer CO2 to the atmosphere, and pH renormalizes. Conversely, a rise in plasma pH initiates a reflex ventilatory decrease, and CO2 is retained. Ventilatory responses require several minutes to take effect and, if the underlying cause is a metabolic disturbance, may never be sufficient to compensate fully. Respiratory control pathways are considered in Chapter 24. The role of the kidneys in pH balance is detailed in Unit VI, Urinary System.
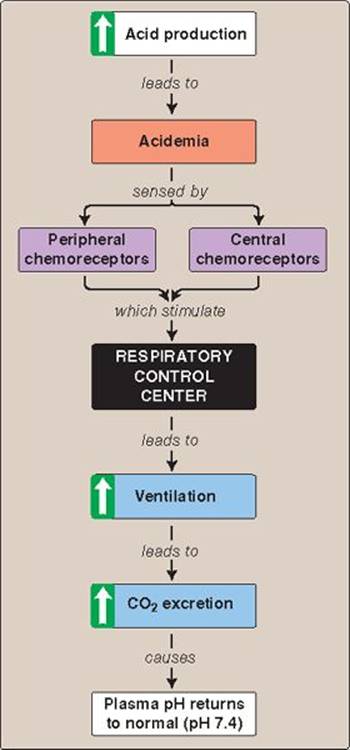
Figure 23.26
Concept map for ventilatory response to acidemia.
Chapter Summary
• O2 and CO2 exchange occurs at the blood–gas interface within the lung. Exchange is enhanced by the large surface area of the interface and the fact that the barrier between blood and air is very thin. Ventilation and perfusion ensure that the partial pressure gradients driving diffusion of O2 and CO2 across the barrier are kept high.
• The interface is perfused by blood from the pulmonary circulation. Pulmonary perfusion pressures are very low, and the vessels have relatively thin walls. These features mean that pulmonary vessels readily expand and collapse in response to extravascular forces.
• Gravitational effects on pulmonary blood vessels in an upright lung create three different zones of flow. Perfusion pressures and flow are lowest at the lung apex (zone 1). Flow is highest at the lung base (zone 3). Gravity also affects alveolar ventilation. Alveoli at the lung apex ventilate poorly, whereas alveoli at the lung base ventilate very well. The combined effects of gravity on perfusion and ventilation mean that most O2 uptake occurs at the base of an upright lung.
• In an ideal lung, alveolar ventilation and perfusion should be perfectly matched (A ratio = 1.0). Mismatches occur because of airway obstruction or loss of perfusion, and the ratio slips toward zero or infinity, respectively
• O2 and CO2 exchange occurs by diffusion, driven by partial pressure gradients for both gases. Diffusion of gases across the alveolar wall is influenced by barrier thickness and total surface area, both of which can become limiting in a diseased lung (diffusion-limited exchange). Net uptake may also be limited by inadequacy of perfusion (perfusionlimited exchange).
• O2 has limited water solubility, so an O2-binding protein (hemoglobin [Hb]) is required to help transport it to the tissues in the quantities required for aerobic respiration. O2 binds to four sites on Hb. The cooperative nature of O2binding ensures blood O2 saturation during passage through the lungs and facilitates O2 release as blood passes through the tissues served by the systemic circulation.
• CO2 is transported in dissolved form, in association with hemoglobin, and as HCO3−. HCO3− forms by dissociation of carbonic acid.
• Because CO2 dissolves in water to form carbonic acid, ventilatory changes that cause CO2 to be excreted at rates that exceed or fail to keep up with CO2 production can result in respiratory alkalosis or acidosis, respectively.
